[Go back]

For Friday, November 22, 2002
© Bob Carver
$-Weighted OEX/QQQ Call/Put Ratios: See Website
Popular Indices: http://www.marketclues.net/cgi-bin/myclues?chart=/:/indices/d/_spx.4903.html&member=@@ ^SPX · http://www.marketclues.net/cgi-bin/myclues?chart=/:/indices/d/_compq.4903.html&member=@@ ^IXQ · http://www.marketclues.net/cgi-bin/myclues?chart=/:/indices/d/_ndx.4903.html&member=@@ ^NDX · http://www.marketclues.net/cgi-bin/myclues?chart=/:/indices/d/_sox.4903.html&member=@@ ^SOX · http://www.marketclues.net/cgi-bin/myclues?chart=/:/indices/d/_dj.4903.html&member=@@ ^DJI · http://www.marketclues.net/cgi-bin/myclues?chart=/:/indices/d/_mid.4903.html&member=@@ ^MID · http://www.marketclues.net/cgi-bin/myclues?chart=/:/indices/d/_oex.4903.html&member=@@ ^OEX · http://www.marketclues.net/cgi-bin/myclues?chart=/:/indices/d/_nya.4903.html&member=@@ ^NYA · http://www.marketclues.net/cgi-bin/myclues?chart=/:/indices/d/_vle.4903.html&member=@@ ^VLE · http://www.marketclues.net/cgi-bin/myclues?chart=/:/indices/d/_rut.4903.html&member=@@ ^RUT · http://www.marketclues.net/cgi-bin/myclues?chart=/:/indices/d/_sml.4903.html&member=@@ ^SML · http://www.marketclues.net/cgi-bin/myclues?chart=/:/futures/d/cr_a0.4903.html&member=@@ ^CRB · http://www.marketclues.net/cgi-bin/myclues?chart=/:/indices/d/_xau.4903.html&member=@@ ^XAU · http://www.marketclues.net/cgi-bin/myclues?chart=/:/indices/d/_btk.4903.html&member=@@ ^BTK · http://www.marketclues.net/cgi-bin/myclues?chart=/:/indices/d/_tyx.4903.html&member=@@ ^TYX
Sector Performance Since: 8 Apr 1999 · 18 Oct 1999 · A Week Ago · A Fortnight Ago
Sector Acceleration Since: 8 Apr 1999 · 18 Oct 1999 · A Week Ago · A Fortnight Ago

MyClues Home Page Link ("http://www.marketclues.net/cgi-bin/myclues?myhome=yes&member;[email protected]")

Advertisement

Stocks: Thrust Rally Continues

There's not a lot to add here after calling for a thrust rally and getting it. This rally is burning through much of the sideline cash and should burn itself out before long. Remember to watch for NDX and SOX to top first, a couple of days before the SPX and DJ.

It's very hot money levitating the market higher as brokers and money managers desperately attempt to drive the market to a higher close for the year as a whole. These managers are paid to earn money and are using various rationalizations to manipulate the indices. They've been doing this since early October to push the stock market up into the Election. Now, they've driving toward eliminating the possibility of a third straight year of losses in the Dow and S&P 500.

While they may temporarily control stock prices, they will eventually lose control. And, something they very definitely do not have control over is the possibility of a terrorist attack on the scale of 911. When that happens, these euphoric feelings will evaporate very quickly.

If you're long the market for the rally, be sure to keep very tight stop losses: this is, after all, a thrust rally, which means it will burn itself out very quickly.

Note: a discussion of when this thrust rally will burn itself out and produce the next major intermediate top continues on our Detailed Comments Page.

Format for printing. [Go back]

For Thursday, November 21, 2002
© Bob Carver
$-Weighted OEX/QQQ Call/Put Ratios: See Website
Popular Indices: http://www.marketclues.net/cgi-bin/myclues?chart=/:/indices/d/_spx.4903.html&member=@@ ^SPX · http://www.marketclues.net/cgi-bin/myclues?chart=/:/indices/d/_compq.4903.html&member=@@ ^IXQ · http://www.marketclues.net/cgi-bin/myclues?chart=/:/indices/d/_ndx.4903.html&member=@@ ^NDX · http://www.marketclues.net/cgi-bin/myclues?chart=/:/indices/d/_sox.4903.html&member=@@ ^SOX · http://www.marketclues.net/cgi-bin/myclues?chart=/:/indices/d/_dj.4903.html&member=@@ ^DJI · http://www.marketclues.net/cgi-bin/myclues?chart=/:/indices/d/_mid.4903.html&member=@@ ^MID · http://www.marketclues.net/cgi-bin/myclues?chart=/:/indices/d/_oex.4903.html&member=@@ ^OEX · http://www.marketclues.net/cgi-bin/myclues?chart=/:/indices/d/_nya.4903.html&member=@@ ^NYA · http://www.marketclues.net/cgi-bin/myclues?chart=/:/indices/d/_vle.4903.html&member=@@ ^VLE · http://www.marketclues.net/cgi-bin/myclues?chart=/:/indices/d/_rut.4903.html&member=@@ ^RUT · http://www.marketclues.net/cgi-bin/myclues?chart=/:/indices/d/_sml.4903.html&member=@@ ^SML · http://www.marketclues.net/cgi-bin/myclues?chart=/:/futures/d/cr_a0.4903.html&member=@@ ^CRB · http://www.marketclues.net/cgi-bin/myclues?chart=/:/indices/d/_xau.4903.html&member=@@ ^XAU · http://www.marketclues.net/cgi-bin/myclues?chart=/:/indices/d/_btk.4903.html&member=@@ ^BTK · http://www.marketclues.net/cgi-bin/myclues?chart=/:/indices/d/_tyx.4903.html&member=@@ ^TYX
Sector Performance Since: 8 Apr 1999 · 18 Oct 1999 · A Week Ago · A Fortnight Ago
Sector Acceleration Since: 8 Apr 1999 · 18 Oct 1999 · A Week Ago · A Fortnight Ago

MyClues Home Page Link ("http://www.marketclues.net/cgi-bin/myclues?myhome=yes&member;[email protected]")

Advertisement

Stocks: Lead Dogs Surge

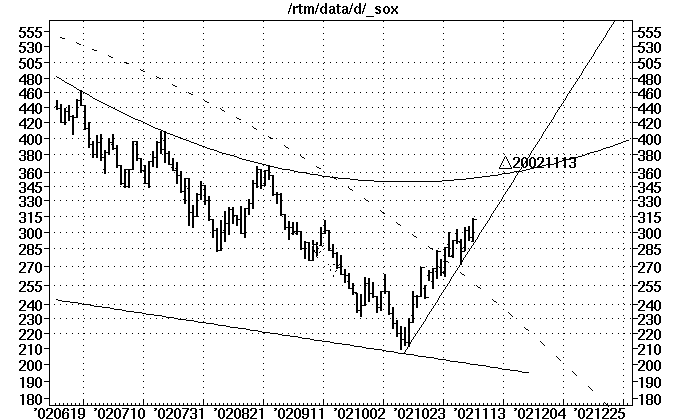
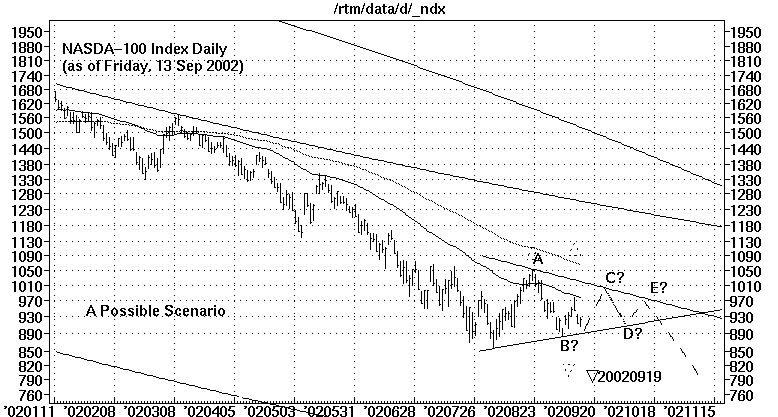
Our lead dog indices, NDX (NASDAQ-100) and SOX (Semiconductors), have been telling us this bear market rally wasn't over. They have been leading since October 8th, bottoming two days ahead of the blue chips, and have been stronger all the way up as the
ETF 20-Day Heat Map illustrates (which the QQQ and IGW entries graphically illustrate).

In the prior update we said,

``Stocks on the short term continue to work sideways in what could be a contracting triangle in the wave B position (counting the October 10-November 6 move from Dow 7200 to 8800 as an overall wave A). This is short term bullish if the pattern works to completion because it could resolve into a thrust rally in wave C. If the short term pattern is a contracting triangle, we should get a complete pattern this week and an up thrust into Monday or Tuesday.''

The lead dogs jumped out ahead of the pack Wednesday as our Relative Strength Page illustrates — this page is a subwindow on our Trading Page, where it automatically refreshes itself every minute during the trading day. The lead dogs were clearly out in front despite the early selloff to test support lines, signaling that the market still had work to do on the upside. Here is a snapshot of the table taken during the final minutes of trading Wednesday illustrating these points:

Relative Strength ofCompared toStrengthQuote Age
NDXDJ  +2.29% 39s
NDXSPX  +2.12% 9s
SOXDJ  +5.16% 39s
MIDSPX  +0.18% 9s
SMLSPX  -0.13% 9s
VLESPX  +0.10% 9s

Despite the strength the lead dogs are showing, however, they will top out about two trading days ahead of the next intermediate top in the market. Consequently, with important turn dates due next week, we have to carefully watch for signs of weakness in the ``dogs'' to signal an important turn. That turn could be to a very strong resumption of the underlying bear market trend.

Format for printing. [Go back]

For Wednesday, November 20, 2002
© Bob Carver
$-Weighted OEX/QQQ Call/Put Ratios: See Website
Popular Indices: http://www.marketclues.net/cgi-bin/myclues?chart=/:/indices/d/_spx.4903.html&member=@@ ^SPX · http://www.marketclues.net/cgi-bin/myclues?chart=/:/indices/d/_compq.4903.html&member=@@ ^IXQ · http://www.marketclues.net/cgi-bin/myclues?chart=/:/indices/d/_ndx.4903.html&member=@@ ^NDX · http://www.marketclues.net/cgi-bin/myclues?chart=/:/indices/d/_sox.4903.html&member=@@ ^SOX · http://www.marketclues.net/cgi-bin/myclues?chart=/:/indices/d/_dj.4903.html&member=@@ ^DJI · http://www.marketclues.net/cgi-bin/myclues?chart=/:/indices/d/_mid.4903.html&member=@@ ^MID · http://www.marketclues.net/cgi-bin/myclues?chart=/:/indices/d/_oex.4903.html&member=@@ ^OEX · http://www.marketclues.net/cgi-bin/myclues?chart=/:/indices/d/_nya.4903.html&member=@@ ^NYA · http://www.marketclues.net/cgi-bin/myclues?chart=/:/indices/d/_vle.4903.html&member=@@ ^VLE · http://www.marketclues.net/cgi-bin/myclues?chart=/:/indices/d/_rut.4903.html&member=@@ ^RUT · http://www.marketclues.net/cgi-bin/myclues?chart=/:/indices/d/_sml.4903.html&member=@@ ^SML · http://www.marketclues.net/cgi-bin/myclues?chart=/:/futures/d/cr_a0.4903.html&member=@@ ^CRB · http://www.marketclues.net/cgi-bin/myclues?chart=/:/indices/d/_xau.4903.html&member=@@ ^XAU · http://www.marketclues.net/cgi-bin/myclues?chart=/:/indices/d/_btk.4903.html&member=@@ ^BTK · http://www.marketclues.net/cgi-bin/myclues?chart=/:/indices/d/_tyx.4903.html&member=@@ ^TYX
Sector Performance Since: 8 Apr 1999 · 18 Oct 1999 · A Week Ago · A Fortnight Ago
Sector Acceleration Since: 8 Apr 1999 · 18 Oct 1999 · A Week Ago · A Fortnight Ago

MyClues Home Page Link ("http://www.marketclues.net/cgi-bin/myclues?myhome=yes&member;[email protected]")

Advertisement

Stocks:

We hope you're enjoying Free Week at Elliott Wave International. If you haven't done so, the URL to sign up is
"http://www.elliottwave.com/a.asp?url=http://www.elliottwave.com/freeweek&cn;=mktclue".

The trading range, directionless stock market waffled around again on Tuesday, although a brief intraday rally sparked a bit of short covering in mid-session. But, the gains could not be sustained. The market is waiting for something to give it direction. Interestingly, it could have reacted badly to the news that Iraq has violated the most recent UN resolution and thus has invited the coalition to attack, but apparently, that bit of news had already been discounted by the market.

We are expecting this current period of narrowing trading range to be the calm before the storm. Low volatility regimes build up energy for high volatility once a spark ignites the crowd. We have several turning points due soon which point toward a big surge directly ahead.

Gold stocks sold off Tuesday as the narrowing trading range works slowly toward the day of reckoning. This market also confirms that a high volatility move is coming. With commercials short and speculators long, the smart money is betting that gold prices will be lower at some point in the future. However, that is a long term perspective and a short term thrust rally would be consistent with the longer term bear trend these stocks have been in for the last couple of decades. The timing of that thrust depends upon when the triangle is complete. That should be coming up in the near future.

Note: detailed comments will be found on our Detailed Comments Page.

Fixed Income Exchange-Traded Funds We have summarized the fixed-income exchange-traded funds in this page ("http://www.marketclues.net/clues/fixedincomeetfs.html"). These make a good place to invest during weak periods in the stock market. They have the advantage of stocks (they can be traded when the market is open) and move in the opposite direction.

Format for printing. [Go back]

For Tuesday, November 19, 2002
© Bob Carver
$-Weighted OEX/QQQ Call/Put Ratios: See Website
Popular Indices: http://www.marketclues.net/cgi-bin/myclues?chart=/:/indices/d/_spx.4903.html&member=@@ ^SPX · http://www.marketclues.net/cgi-bin/myclues?chart=/:/indices/d/_compq.4903.html&member=@@ ^IXQ · http://www.marketclues.net/cgi-bin/myclues?chart=/:/indices/d/_ndx.4903.html&member=@@ ^NDX · http://www.marketclues.net/cgi-bin/myclues?chart=/:/indices/d/_sox.4903.html&member=@@ ^SOX · http://www.marketclues.net/cgi-bin/myclues?chart=/:/indices/d/_dj.4903.html&member=@@ ^DJI · http://www.marketclues.net/cgi-bin/myclues?chart=/:/indices/d/_mid.4903.html&member=@@ ^MID · http://www.marketclues.net/cgi-bin/myclues?chart=/:/indices/d/_oex.4903.html&member=@@ ^OEX · http://www.marketclues.net/cgi-bin/myclues?chart=/:/indices/d/_nya.4903.html&member=@@ ^NYA · http://www.marketclues.net/cgi-bin/myclues?chart=/:/indices/d/_vle.4903.html&member=@@ ^VLE · http://www.marketclues.net/cgi-bin/myclues?chart=/:/indices/d/_rut.4903.html&member=@@ ^RUT · http://www.marketclues.net/cgi-bin/myclues?chart=/:/indices/d/_sml.4903.html&member=@@ ^SML · http://www.marketclues.net/cgi-bin/myclues?chart=/:/futures/d/cr_a0.4903.html&member=@@ ^CRB · http://www.marketclues.net/cgi-bin/myclues?chart=/:/indices/d/_xau.4903.html&member=@@ ^XAU · http://www.marketclues.net/cgi-bin/myclues?chart=/:/indices/d/_btk.4903.html&member=@@ ^BTK · http://www.marketclues.net/cgi-bin/myclues?chart=/:/indices/d/_tyx.4903.html&member=@@ ^TYX
Sector Performance Since: 8 Apr 1999 · 18 Oct 1999 · A Week Ago · A Fortnight Ago
Sector Acceleration Since: 8 Apr 1999 · 18 Oct 1999 · A Week Ago · A Fortnight Ago

MyClues Home Page Link ("http://www.marketclues.net/cgi-bin/myclues?myhome=yes&member;[email protected]")

Advertisement

Free Week Begins Today at ElliottWave.com

Today at 5 p.m. EST, Ellottwave International (link: "http://www.elliottwave.com/a.asp?url=freeweek&cn;=mktclue") opens their doors for another free week for Market Clues subscribers. Use the link above to sign up!

Stocks:

The stock market completed five waves up Monday morning and started a retracement. We have been looking for a correction of normal proportions (38-62%) of the preceding advance at the very least, but it appears that the sideline money continues to flow into high tech stocks despite historic high valuation levels.

One confirmation of a more substantial top in place we would have liked to have seen: weakness in the NASDAQ-100 or Semiconductor Indices, our ``lead-dogs'' which typically put in tops and bottoms a couple of days ahead of the rest of the market. That didn't happen Monday and until it does the likelihood of a substantial retracement is greatly diminished.

The other item of note in an otherwise dull Monday session was the behavior of QQQ option traders. They started the day heavily buying put options (a bet that the NASDAQ-100 Index would go down substantially) — and they were right on the very short term. However, by mid-afternoon, they were buying call options (bets that the NASDAQ-100 would rise substantially). It has been conjectured by some that program traders are using the QQQ options to pump up some of their arbitrage profits. If that's the case, the rise in call buying is bullish. On the other hand, if speculators are buying the dip, that's bearish. Until we have more history of this option series, we can't make a definitive statement about this indicator. The action was very interesting, however.

Several indicators point to a top in this timeframe. However, those forward-looking indicators can be early and we need to have more coincident indicators confirming them before we can declare this bear market rally at an end. We do suggest that the longer the market spends in this price range, the worse the decline to come is going to be. Just as a long period of base building precedes a strong runup in a bull market, a long period of ceiling building precedes a strong decline in a bear market.

Format for printing. [Go back]

For Monday, November 18, 2002
© Bob Carver
$-Weighted OEX/QQQ Call/Put Ratios: 1.35/2.16
Popular Indices: http://www.marketclues.net/cgi-bin/myclues?chart=/:/indices/d/_spx.4903.html&member=@@ ^SPX · http://www.marketclues.net/cgi-bin/myclues?chart=/:/indices/d/_compq.4903.html&member=@@ ^IXQ · http://www.marketclues.net/cgi-bin/myclues?chart=/:/indices/d/_ndx.4903.html&member=@@ ^NDX · http://www.marketclues.net/cgi-bin/myclues?chart=/:/indices/d/_sox.4903.html&member=@@ ^SOX · http://www.marketclues.net/cgi-bin/myclues?chart=/:/indices/d/_dj.4903.html&member=@@ ^DJI · http://www.marketclues.net/cgi-bin/myclues?chart=/:/indices/d/_mid.4903.html&member=@@ ^MID · http://www.marketclues.net/cgi-bin/myclues?chart=/:/indices/d/_oex.4903.html&member=@@ ^OEX · http://www.marketclues.net/cgi-bin/myclues?chart=/:/indices/d/_nya.4903.html&member=@@ ^NYA · http://www.marketclues.net/cgi-bin/myclues?chart=/:/indices/d/_vle.4903.html&member=@@ ^VLE · http://www.marketclues.net/cgi-bin/myclues?chart=/:/indices/d/_rut.4903.html&member=@@ ^RUT · http://www.marketclues.net/cgi-bin/myclues?chart=/:/indices/d/_sml.4903.html&member=@@ ^SML · http://www.marketclues.net/cgi-bin/myclues?chart=/:/futures/d/cr_a0.4903.html&member=@@ ^CRB · http://www.marketclues.net/cgi-bin/myclues?chart=/:/indices/d/_xau.4903.html&member=@@ ^XAU · http://www.marketclues.net/cgi-bin/myclues?chart=/:/indices/d/_btk.4903.html&member=@@ ^BTK · http://www.marketclues.net/cgi-bin/myclues?chart=/:/indices/d/_tyx.4903.html&member=@@ ^TYX
Sector Performance Since: 8 Apr 1999 · 18 Oct 1999 · A Week Ago · A Fortnight Ago
Sector Acceleration Since: 8 Apr 1999 · 18 Oct 1999 · A Week Ago · A Fortnight Ago

MyClues Home Page Link ("http://www.marketclues.net/cgi-bin/myclues?myhome=yes&member;[email protected]")

Advertisement

Stocks: Range Trading

Last week unfolded very much as we described one week ago:

``If you're a short term trader, however, you're going to like this market because you like to play it from both short and long positions. There should be ample opportunities to do both in the coming months. But, if you're a longer term investor, you have to look for a narrowing trading range here until the Iraq situation is finally settled. And, that could be many months.''

That's exactly what we're seeing here on all of the major indices. The week began with a dip and ended with a flourish for the bulls as option expiration saw price manipulation of individual stocks to expire call and put options worthless. Some indices were weaker and some were stronger, so it's a mixed picture. Our ``lead-dog'' index, the NASDAQ-100 Index (NDX or QQQ), was relatively strong and hovered near its recovery high and a resistance trendline at the close of trading Friday. The Dow was mired in the range over two hundred points below its high of the previous week (8800). A glance at the 5-day relative strength report shows that tech sectors were leading. Such sectors as semiconductors, internet, software and networking put in net gains for the week. However, almost all daily charts on these sectors indicate that strength here is a fleeting proposition. That's because we're seeing bearish divergence as those new highs are not confirmed by corresponding highs on our oscillators.

Sentiment remains a roadblock to rally in the stock market. Our short term options-based sentiment gauges show far too much bullishness for the market to make big gains. Those figures are confirmed by longer term sentiment gauges such as Investor's Intelligence which reported that over half of all advisors are now bullish — that's more than twice the number bullish at the bottom last month! That's a huge swing in sentiment which cannot be discounted. Apparently, this bear market rally has had its intended effect on the minds of market watchers. If this were a new bull market (as we had hoped it would be), the bears would still be in the majority and would be vocally calling for a crash. Instead, the bulls are out in force, urging investors to buy before prices move much higher. That's not a sign of a bull market environment.

Note: further and more detailed comments will be found on our Detailed Comments Page.

Fixed Income Exchange-Traded Funds We have summarized the fixed-income exchange-traded funds in this page ("http://www.marketclues.net/clues/fixedincomeetfs.html"). These make a good place to invest during weak periods in the stock market. They have the advantage of stocks (they can be traded when the market is open) and move in the opposite direction.

Euro Currency: http://www.marketclues.net/cgi-bin/myclues?chart=/:/futures/d/ec_a0.4903.html&member=wcorney@keatepartners.com

The Euro couldn't make a new high on the failure of the central bank to cut rates after the US Fed cut short term rates the prior week. This failure to move to a new high is bearish for the currency and for the European economy. Is deflation ahead for Europe? It's looking more and more likely.

U.S. Dollar Index: http://www.marketclues.net/cgi-bin/myclues?chart=/:/futures/d/dx_a0.4903.html&member=wcorney@keatepartners.com

The US dollar spent the week recovering from the prior week's selloff on the Fed rate cut. Remember, the US Dollar Index moves almost exactly inversely to the Euro.

Canadian Dollar: http://www.marketclues.net/cgi-bin/myclues?chart=/:/futures/d/cd_a0.4903.html&member=wcorney@keatepartners.com

The Canadian Dollar is trapped in a trading range within a long term bear market. We expect a breakdown of the range will usher in a strong move to the downside.

S&P Toronto Stock Exchange http://www.marketclues.net/cgi-bin/myclues?chart=/:/indices/d/_sptse.4903.html&member=wcorney@keatepartners.com

The Canadian stock market showed strength in price last week, but the rally wasn't confirmed by our oscillators, suggesting very limited upside potential.

Australian Dollar: http://www.marketclues.net/cgi-bin/myclues?chart=/:/futures/d/ad_a0.4903.html&member=wcorney@keatepartners.com

The A$ was not able to break through the long term resistance line in the weekly chart last week. As long as that trendline is honored, we continue to believe that the A$ will eventually plumb the lows (below 48¢).

Australian All Ordinaries: http://www.marketclues.net/cgi-bin/myclues?chart=/:/indices/d/_aord.4903.html&member=wcorney@keatepartners.com

The All-Ords continued weaker last week although it closed near the highs. The brown resistance polytrendline points toward a down cycle lasting into the end of the first quarter of 2003 and may be predictive that the new bull market may not get off the ground until after that timeframe.
Australia Business News http://www.abc.net.au/news/business/default.htm
Yahoo! Australia Business News http://au.dailynews.yahoo.com/Full_Coverage/Australian_Economy/

London Financial-Times 100: http://www.marketclues.net/cgi-bin/myclues?chart=/:/indices/d/_ftse.4903.html&member=wcorney@keatepartners.com

The FTSE has been stuck in a trading range below a resistance polytrendline that won't bottom until the first quarter of next year. Without a breakout, expect more of the same.

Bonds / Interest Rates:

Stronger economic news last week set bonds back late in the week, but the uptrend remains intact in bond prices. And, the chart of the CRB Index suggests strongly that the Fed is not finished cutting interest rates. In fact, cuts in the long bond rate are highly likely in the years ahead as the Fed buys bonds to stave off the looming clouds of deflation.

Last week, the government reported a huge jump in the Producer Price Index. The bond market reacted initially by falling, but recovered completely by the end of the session. It's clear that the numbers were a fantasy and the market's reaction reflects that. Remember, it's the market's reaction to news, not the news itself, that counts.

Target 2030 Zero Coupon Bond Fund Quote

Sectors and Individual Stocks (Subscribers Only)

For tables ranking sectors and individual stocks, and links to charts of 3500 individual stocks and sectors, please visit your very own MyClues Home Page[http://www.marketclues.net/cgi-bin/myclues?myhome=yes&member=@@] -- in the CHARTS & RESEARCH section of the page, you will find a wealth of tools for selecting top sectors and stocks, including access to our exclusive realtime, intraday indicators.

For a 3-4 month free trial subscription, click here.

Commodities (Subscribers Only)

For complete charts of commodities, please visit your very own MyClues Home Page[http://www.marketclues.net/cgi-bin/myclues?myhome=yes&member=@@] -- in the CHARTS & RESEARCH section of the page, you will find links to webpages containing links to the following:

For a 3-4 month free trial subscription, click here.

CRB Index: http://www.marketclues.net/cgi-bin/myclues?chart=/:/futures/d/cr_a0.4903.html&member=wcorney@keatepartners.com

The CRB Index uptrend ended in late October as the uptrend support line was broken. The CRB is attempting to retest that uptrend line from underneath, but it appears that a much larger drop in commodity prices lies ahead. This is bad news from the point of view of deflation and suggests the Fed is not finished cutting interest rates.

Format for printing. [Go back]

For Friday, November 8, 2002
© Bob Carver
$-Weighted OEX/QQQ Call/Put Ratios: See Website
Popular Indices: http://www.marketclues.net/cgi-bin/myclues?chart=/:/indices/d/_spx.4903.html&member=@@ ^SPX · http://www.marketclues.net/cgi-bin/myclues?chart=/:/indices/d/_compq.4903.html&member=@@ ^IXQ · http://www.marketclues.net/cgi-bin/myclues?chart=/:/indices/d/_ndx.4903.html&member=@@ ^NDX · http://www.marketclues.net/cgi-bin/myclues?chart=/:/indices/d/_dj.4903.html&member=@@ ^DJI · http://www.marketclues.net/cgi-bin/myclues?chart=/:/indices/d/_mid.4903.html&member=@@ ^MID · http://www.marketclues.net/cgi-bin/myclues?chart=/:/indices/d/_oex.4903.html&member=@@ ^OEX · http://www.marketclues.net/cgi-bin/myclues?chart=/:/indices/d/_nya.4903.html&member=@@ ^NYA · http://www.marketclues.net/cgi-bin/myclues?chart=/:/indices/d/_vle.4903.html&member=@@ ^VLE · http://www.marketclues.net/cgi-bin/myclues?chart=/:/indices/d/_rut.4903.html&member=@@ ^RUT · http://www.marketclues.net/cgi-bin/myclues?chart=/:/indices/d/_sml.4903.html&member=@@ ^SML · http://www.marketclues.net/cgi-bin/myclues?chart=/:/futures/d/cr_a0.4903.html&member=@@ ^CRB · http://www.marketclues.net/cgi-bin/myclues?chart=/:/indices/d/_xau.4903.html&member=@@ ^XAU · http://www.marketclues.net/cgi-bin/myclues?chart=/:/indices/d/_btk.4903.html&member=@@ ^BTK · http://www.marketclues.net/cgi-bin/myclues?chart=/:/indices/d/_tyx.4903.html&member=@@ ^TYX
Sector Performance Since: 8 Apr 1999 · 18 Oct 1999 · A Week Ago · A Fortnight Ago
Sector Acceleration Since: 8 Apr 1999 · 18 Oct 1999 · A Week Ago · A Fortnight Ago

MyClues Home Page Link ("http://www.marketclues.net/cgi-bin/myclues?myhome=yes&member;[email protected]")

Got Stocks? Do you have money in the stock market? If so, you need to read this valuable excerpt from Chapter 20 of Bob Prechter's new book, Conquer the Crash. By now, you should be familiar with Bob's long-term forecast for stocks - namely, there's still a LONG way to go in this bear market. In this excerpt, Bob offers advice on stocks, mutual funds, short-selling, diversifying, and more. To be fully prepared for the bear market, you need to read all of Conquer the Crash and act on Bob's advice. But, the information you are about to read is a great start.

Stocks: Profits Taken

The market sold off as short term investors and traders took profits: it was buy on the rumor of a rate-cut and sell on the news of the real thing. And, of course, the levitation provided by the election campaign dissipated quickly as the glow of Republican victory faded and the market turned its attention to the economy.

And the economy is sliding down the hill still. It's clear that more stimulation is needed both by the Federal Reserve and by the Congress. Thus, the politicians will now work on making the tax cut permanent, lowering payroll taxes and, perhaps, tossing a bone to the market: eliminating double-taxation of dividends.

Although we believe this is a bear market still, we won't shun buying for a rally when and if we get the chance (detailed in our Detailed Comments Page).

Fixed Income Exchange-Traded Funds We have summarized the fixed-income exchange-traded funds in this page ("http://www.marketclues.net/clues/fixedincomeetfs.html"). These make a good place to invest during weak periods in the stock market. They have the advantage of stocks (they can be traded when the market is open) and move in the opposite direction.

Format for printing. [Go back]

For Thursday, November 7, 2002
© Bob Carver
$-Weighted OEX/QQQ Call/Put Ratios: See Website
Popular Indices: http://www.marketclues.net/cgi-bin/myclues?chart=/:/indices/d/_spx.4903.html&member=@@ ^SPX · http://www.marketclues.net/cgi-bin/myclues?chart=/:/indices/d/_compq.4903.html&member=@@ ^IXQ · http://www.marketclues.net/cgi-bin/myclues?chart=/:/indices/d/_ndx.4903.html&member=@@ ^NDX · http://www.marketclues.net/cgi-bin/myclues?chart=/:/indices/d/_dj.4903.html&member=@@ ^DJI · http://www.marketclues.net/cgi-bin/myclues?chart=/:/indices/d/_mid.4903.html&member=@@ ^MID · http://www.marketclues.net/cgi-bin/myclues?chart=/:/indices/d/_oex.4903.html&member=@@ ^OEX · http://www.marketclues.net/cgi-bin/myclues?chart=/:/indices/d/_nya.4903.html&member=@@ ^NYA · http://www.marketclues.net/cgi-bin/myclues?chart=/:/indices/d/_vle.4903.html&member=@@ ^VLE · http://www.marketclues.net/cgi-bin/myclues?chart=/:/indices/d/_rut.4903.html&member=@@ ^RUT · http://www.marketclues.net/cgi-bin/myclues?chart=/:/indices/d/_sml.4903.html&member=@@ ^SML · http://www.marketclues.net/cgi-bin/myclues?chart=/:/futures/d/cr_a0.4903.html&member=@@ ^CRB · http://www.marketclues.net/cgi-bin/myclues?chart=/:/indices/d/_xau.4903.html&member=@@ ^XAU · http://www.marketclues.net/cgi-bin/myclues?chart=/:/indices/d/_btk.4903.html&member=@@ ^BTK · http://www.marketclues.net/cgi-bin/myclues?chart=/:/indices/d/_tyx.4903.html&member=@@ ^TYX
Sector Performance Since: 8 Apr 1999 · 18 Oct 1999 · A Week Ago · A Fortnight Ago
Sector Acceleration Since: 8 Apr 1999 · 18 Oct 1999 · A Week Ago · A Fortnight Ago

MyClues Home Page Link ("http://www.marketclues.net/cgi-bin/myclues?myhome=yes&member;[email protected]")

Got Stocks? Do you have money in the stock market? If so, you need to read this valuable excerpt from Chapter 20 of Bob Prechter's new book, Conquer the Crash. By now, you should be familiar with Bob's long-term forecast for stocks - namely, there's still a LONG way to go in this bear market. In this excerpt, Bob offers advice on stocks, mutual funds, short-selling, diversifying, and more. To be fully prepared for the bear market, you need to read all of Conquer the Crash and act on Bob's advice. But, the information you are about to read is a great start.

Stocks: Republicans Take Congress

The campaign to rig the election paid off for the Republicans as they took both houses of Congress in the election Tuesday. Then, the Fed cut interest rates by ½ point, generating tremendous confusion in the markets. Does this action signal a panic on the part of the Fed? Does this mean a deflationary spiral has already started? If so, the recent rally in stock prices was on little more than hot air and hope. And, the bear market rally we've enjoyed is just about over.

We always try to listen to the message the markets are sending us. We also pay attention to the potentials. For instance, in July, we recognized an intermediate term bottom in the stock market which just might have been the bear market bottom. Once the rally was underway, however, we realized that it had all the earmarks of a bear market rally — because we listened to what the market was trying to tell us. Ultimately, the July lows were taken out in the next downturn.

Similarly, the October bottom was potentially the end of the bear market and the beginning of a bull market. So far, that hasn't been confirmed. In fact, it has most of the earmarks of a bear market rally like the August rally. Thus, when we listen to what the market is telling us, we are seeing what appears to be something similar to the prior rally: just another bear market affair ultimately leading to new lows in the major indices. Staying on the right side of the market — and controlling risk — are our goals.

Sentiment is wildly bullish right now according to our Dollar-Weighted Option figures. OEX traders went heavily toward the overly-bullish mark on Wednesday and the recovery into the close pushed them even further into the bullish camp.

After the cash stock market closed, the futures markets sold off, signaling that short term traders are saying they think we've seen the top in this move.

Note: further comments for subscribers only will be found on our Detailed Comments Page.

Fixed Income Exchange-Traded Funds We have summarized the fixed-income exchange-traded funds in this page ("http://www.marketclues.net/clues/fixedincomeetfs.html"). These make a good place to invest during weak periods in the stock market. They have the advantage of stocks (they can be traded when the market is open) and move in the opposite direction.

Format for printing. [Go back]

For Wednesday, November 6, 2002
© Bob Carver
$-Weighted OEX/QQQ Call/Put Ratios: See Website
Popular Indices: http://www.marketclues.net/cgi-bin/myclues?chart=/:/indices/d/_spx.4903.html&member=@@ ^SPX · http://www.marketclues.net/cgi-bin/myclues?chart=/:/indices/d/_compq.4903.html&member=@@ ^IXQ · http://www.marketclues.net/cgi-bin/myclues?chart=/:/indices/d/_ndx.4903.html&member=@@ ^NDX · http://www.marketclues.net/cgi-bin/myclues?chart=/:/indices/d/_dj.4903.html&member=@@ ^DJI · http://www.marketclues.net/cgi-bin/myclues?chart=/:/indices/d/_mid.4903.html&member=@@ ^MID · http://www.marketclues.net/cgi-bin/myclues?chart=/:/indices/d/_oex.4903.html&member=@@ ^OEX · http://www.marketclues.net/cgi-bin/myclues?chart=/:/indices/d/_nya.4903.html&member=@@ ^NYA · http://www.marketclues.net/cgi-bin/myclues?chart=/:/indices/d/_vle.4903.html&member=@@ ^VLE · http://www.marketclues.net/cgi-bin/myclues?chart=/:/indices/d/_rut.4903.html&member=@@ ^RUT · http://www.marketclues.net/cgi-bin/myclues?chart=/:/indices/d/_sml.4903.html&member=@@ ^SML · http://www.marketclues.net/cgi-bin/myclues?chart=/:/futures/d/cr_a0.4903.html&member=@@ ^CRB · http://www.marketclues.net/cgi-bin/myclues?chart=/:/indices/d/_xau.4903.html&member=@@ ^XAU · http://www.marketclues.net/cgi-bin/myclues?chart=/:/indices/d/_btk.4903.html&member=@@ ^BTK · http://www.marketclues.net/cgi-bin/myclues?chart=/:/indices/d/_tyx.4903.html&member=@@ ^TYX
Sector Performance Since: 8 Apr 1999 · 18 Oct 1999 · A Week Ago · A Fortnight Ago
Sector Acceleration Since: 8 Apr 1999 · 18 Oct 1999 · A Week Ago · A Fortnight Ago

MyClues Home Page Link ("http://www.marketclues.net/cgi-bin/myclues?myhome=yes&member;[email protected]")

Got Stocks? Do you have money in the stock market? If so, you need to read this valuable excerpt from Chapter 20 of Bob Prechter's new book, Conquer the Crash. By now, you should be familiar with Bob's long-term forecast for stocks - namely, there's still a LONG way to go in this bear market. In this excerpt, Bob offers advice on stocks, mutual funds, short-selling, diversifying, and more. To be fully prepared for the bear market, you need to read all of Conquer the Crash and act on Bob's advice. But, the information you are about to read is a great start.

Stocks: Levitation Day

During this period of time when cycles are pointing down, it's quite an accomplishment for the Republicans to have levitated the market all the way into Election Day. We wonder if, perhaps, this might be a preview of future fiscal policy we can expect out of the Bush Administration going into the 2004 election.

The crash in the stock market over the past couple of years has taken much of the wind out of government sails. Not only has the Federal government suffered reduced capital gains and income tax revenue, but the states have as well. Those governmental units made the classic fiscal mistake: that is, just as a bull market makes everyone a market genius, rising tax revenues from the bubble market of the 'Nineties made the politicos think the largesse would never end. And, you know what politicians do with more money? They spend it, of course! Now that the revenues are falling and the economy slumped in a two-year recession (so far), the normal Keynesian solution (increased government spending to boost a sagging economy) can't be counted on. Instead, what we have are state governments cutting back on their expenditures to balance budgets — creating a drag when they should be stimulating the economy by spending more.

But, has the Bush Administration re-election team indeed found the Golden Goose of market manipulation? If they have, they have solved two problems with one solution. By boosting the stock market back into Bubble-land, they re-energize government revenue and spending, helping revitalize the economy. And, they make people richer and more prone to voting Republican in the next election.

No, we don't seriously think they can keep it up. This kind of manipulation can work for a few weeks in a seasonally strong period, but they aren't likely to be able to fool everyone all the time. But, you've probably noticed there haven't been too many folks complaining about this rally, have you? Strange how quiet the critics get when the market is going up!

In any case, economic reality is likely to set in no later than next month — we're still suffering through a recession. Near term, we're probably going to see the market sell off on profit-taking when the Fed meets today and announces they are cutting short term rates ¼%. Oh, there might be an initial pop fly rally, but it's likely to be sold heavily by the hedge funds. Unless we see large amounts of money going into the QQQ call options, we'll look for a 50% retracement of the October rally to get started no later than 2:15 p.m. EST Wednesday (that's when the Fed announcement comes out). The market should selloff into the weekend, put in a base and rally into the late November timeframe for an intermediate top. After that, things could get really strong on the downside for several months.

That is, unless the RATs have more tricks up their sleeves. We'll watch the indicators for signs they have found a more permanent solution to current levels in the stock market. Our working assumption remains that this rally is a bear market rally and that market indices are going much lower next year.

Fixed Income Exchange-Traded Funds We have summarized the fixed-income exchange-traded funds in this page ("http://www.marketclues.net/clues/fixedincomeetfs.html"). These make a good place to invest during weak periods in the stock market. They have the advantage of stocks (they can be traded when the market is open) and move in the opposite direction.

Format for printing. [Go back]

For Tuesday, November 5, 2002
© Bob Carver
$-Weighted OEX/QQQ Call/Put Ratios: See Website
Popular Indices: http://www.marketclues.net/cgi-bin/myclues?chart=/:/indices/d/_spx.4903.html&member=@@ ^SPX · http://www.marketclues.net/cgi-bin/myclues?chart=/:/indices/d/_compq.4903.html&member=@@ ^IXQ · http://www.marketclues.net/cgi-bin/myclues?chart=/:/indices/d/_ndx.4903.html&member=@@ ^NDX · http://www.marketclues.net/cgi-bin/myclues?chart=/:/indices/d/_dj.4903.html&member=@@ ^DJI · http://www.marketclues.net/cgi-bin/myclues?chart=/:/indices/d/_mid.4903.html&member=@@ ^MID · http://www.marketclues.net/cgi-bin/myclues?chart=/:/indices/d/_oex.4903.html&member=@@ ^OEX · http://www.marketclues.net/cgi-bin/myclues?chart=/:/indices/d/_nya.4903.html&member=@@ ^NYA · http://www.marketclues.net/cgi-bin/myclues?chart=/:/indices/d/_vle.4903.html&member=@@ ^VLE · http://www.marketclues.net/cgi-bin/myclues?chart=/:/indices/d/_rut.4903.html&member=@@ ^RUT · http://www.marketclues.net/cgi-bin/myclues?chart=/:/indices/d/_sml.4903.html&member=@@ ^SML · http://www.marketclues.net/cgi-bin/myclues?chart=/:/futures/d/cr_a0.4903.html&member=@@ ^CRB · http://www.marketclues.net/cgi-bin/myclues?chart=/:/indices/d/_xau.4903.html&member=@@ ^XAU · http://www.marketclues.net/cgi-bin/myclues?chart=/:/indices/d/_btk.4903.html&member=@@ ^BTK · http://www.marketclues.net/cgi-bin/myclues?chart=/:/indices/d/_tyx.4903.html&member=@@ ^TYX
Sector Performance Since: 8 Apr 1999 · 18 Oct 1999 · A Week Ago · A Fortnight Ago
Sector Acceleration Since: 8 Apr 1999 · 18 Oct 1999 · A Week Ago · A Fortnight Ago

MyClues Home Page Link ("http://www.marketclues.net/cgi-bin/myclues?myhome=yes&member;[email protected]")

Got Stocks? Do you have money in the stock market? If so, you need to read this valuable excerpt from Chapter 20 of Bob Prechter's new book, Conquer the Crash. By now, you should be familiar with Bob's long-term forecast for stocks - namely, there's still a LONG way to go in this bear market. In this excerpt, Bob offers advice on stocks, mutual funds, short-selling, diversifying, and more. To be fully prepared for the bear market, you need to read all of Conquer the Crash and act on Bob's advice. But, the information you are about to read is a great start.

Stocks: Running Stocks Up The Flagpole

The US Treasury Dept ran the flag up the pole Monday — the Republican re-election stock market flag, that is. Money poured into overblown, overhyped and overvalued NASDAQ stocks and flowed out of the blue chips, a sign of concentrated buying by the Plunge Protection Team — in this case, the Republican Aid Team (RAT). Now you know why the market smelled that way!

Internals were poor, with barely more stocks advancing than declining. And, volume was very concentrated in advancing issues (i.e., those the RATs were buying): the Arms Index for NASDAQ came in at 0.25.

By mid-afternoon, most traders sensed that the RATs might have lost control and were in trouble — the market suddenly made a U-turn to the downside. By the close, the Dow Industrials had dropped 160.84 points off its high of the day, ending only 48.20 points off its low, but still up slightly from Friday's closing level.

The RATs need to levitate the market on Tuesday to keep the voters in a good mood when they go to the polls to vote for Republicans (or, so they hope — we think even the average voter has smelled a rat). So, we'll be looking for them to be buying Tuesday, especially in the NASDAQ-100 futures and options (watch the QQQ dollar-weighted option ratio for an indication of such activity). But, time is running out and so is the pattern: the rally from early October has taken on the form of an ABC — and it's almost complete now. Ideally, we should see a 50% retracement before any further rally. The RATs may have even used up most of the sideline cash in this rally, but we will have to see the nature of the retracement to judge whether we will get that rally into late November or early December.

Format for printing. [Go back]

For Monday, November 4, 2002
© Bob Carver
$-Weighted OEX/QQQ Call/Put Ratios: 1.16/2.79
Popular Indices: http://www.marketclues.net/cgi-bin/myclues?chart=/:/indices/d/_spx.4903.html&member=@@ ^SPX · http://www.marketclues.net/cgi-bin/myclues?chart=/:/indices/d/_compq.4903.html&member=@@ ^IXQ · http://www.marketclues.net/cgi-bin/myclues?chart=/:/indices/d/_ndx.4903.html&member=@@ ^NDX · http://www.marketclues.net/cgi-bin/myclues?chart=/:/indices/d/_dj.4903.html&member=@@ ^DJI · http://www.marketclues.net/cgi-bin/myclues?chart=/:/indices/d/_mid.4903.html&member=@@ ^MID · http://www.marketclues.net/cgi-bin/myclues?chart=/:/indices/d/_oex.4903.html&member=@@ ^OEX · http://www.marketclues.net/cgi-bin/myclues?chart=/:/indices/d/_nya.4903.html&member=@@ ^NYA · http://www.marketclues.net/cgi-bin/myclues?chart=/:/indices/d/_vle.4903.html&member=@@ ^VLE · http://www.marketclues.net/cgi-bin/myclues?chart=/:/indices/d/_rut.4903.html&member=@@ ^RUT · http://www.marketclues.net/cgi-bin/myclues?chart=/:/indices/d/_sml.4903.html&member=@@ ^SML · http://www.marketclues.net/cgi-bin/myclues?chart=/:/futures/d/cr_a0.4903.html&member=@@ ^CRB · http://www.marketclues.net/cgi-bin/myclues?chart=/:/indices/d/_xau.4903.html&member=@@ ^XAU · http://www.marketclues.net/cgi-bin/myclues?chart=/:/indices/d/_btk.4903.html&member=@@ ^BTK · http://www.marketclues.net/cgi-bin/myclues?chart=/:/indices/d/_tyx.4903.html&member=@@ ^TYX
Sector Performance Since: 8 Apr 1999 · 18 Oct 1999 · A Week Ago · A Fortnight Ago
Sector Acceleration Since: 8 Apr 1999 · 18 Oct 1999 · A Week Ago · A Fortnight Ago

MyClues Home Page Link ("http://www.marketclues.net/cgi-bin/myclues?myhome=yes&member;[email protected]")

Got Stocks? Do you have money in the stock market? If so, you need to read this valuable excerpt from Chapter 20 of Bob Prechter's new book, Conquer the Crash. By now, you should be familiar with Bob's long-term forecast for stocks - namely, there's still a LONG way to go in this bear market. In this excerpt, Bob offers advice on stocks, mutual funds, short-selling, diversifying, and more. To be fully prepared for the bear market, you need to read all of Conquer the Crash and act on Bob's advice. But, the information you are about to read is a great start.

Stocks: SOX on Fire

The Semiconductor Index (SOX) tipped the current rally and is moving higher. However, it has gotten far ahead of fundamentals and constitutes a reflation of the recent bubble. After falling over 85% from its all-time high, it has risen almost 50% in recent weeks. Is the rise over, or can we expect more? The answer to that question will tell us much about the fate of the market.

The stock market, in fact, is quite overbought and in need of a retracement (correction), but is likely to continue its upward trend for a few more weeks.

We have found that one of our indicators has been able to call almost every short term turn in the market recently. We were surprised because this indicator has been behaving exactly opposite to its historical pattern. Why and how this has happened is behind recent insider moves in the market. Although this new finding has greatest significance to short term traders, longer term investors may find it helpful to know how we can get an inside glimpse into the forces which move the market on a daily basis. This indicator is updated several times each trading hour on our Trading Page.

Other forecasting indicators, one of which has nailed every recent turn in the stock market, are looking for a near term reaction, followed by a strong move in the other direction.

Note: detailed comments which expand on the above (and answer some questions posed) will be found on our Detailed Comments Page.

Fixed Income Exchange-Traded Funds We have summarized the fixed-income exchange-traded funds in this page ("http://www.marketclues.net/clues/fixedincomeetfs.html"). These make a good place to invest during weak periods in the stock market. They have the advantage of stocks (they can be traded when the market is open) and move in the opposite direction.

Euro Currency: http://www.marketclues.net/cgi-bin/myclues?chart=/:/futures/d/ec_a0.4903.html&member=wcorney@keatepartners.com

The Euro rallied last week on the coming rate cut by the US Federal Reserve. However, this is likely to be the last fling to the upside for a long time to come. That's because the current rally is best counted as a thrust rally — and those don't last long before a trend change in the opposite direction. Near term, the rally needs to pull back slightly and we should see some retracement before a final high. At that point, the Euro is likely to resume its downtrend.

Commercial interests remain very bearish on the Euro, now holding 23,470 long contracts versus 67,459 short contracts on the Chicago Merc, an increase in net short position of 7894 contracts in just the last week. Who's long (bullish) the Euro? Small and large traders. That's hot money which can change position in the blink of an eye.

U.S. Dollar Index: http://www.marketclues.net/cgi-bin/myclues?chart=/:/futures/d/dx_a0.4903.html&member=wcorney@keatepartners.com

The Dollar Index is moving exactly inversely to the Euro. It should test the prior low at 103.54.

Canadian Dollar: http://www.marketclues.net/cgi-bin/myclues?chart=/:/futures/d/cd_a0.4903.html&member=wcorney@keatepartners.com

The rally appears to be over or almost over. The currency has not quite reached its prior high (which was a 50% retracement level of the previous leg down). Still bearish, with commercials holding 43,129 contracts short to 12,775 long — a substantial increase in their net short position over the preceding week (+7296).

S&P Toronto Stock Exchange http://www.marketclues.net/cgi-bin/myclues?chart=/:/indices/d/_sptse.4903.html&member=wcorney@keatepartners.com

The Canadian market is moving more in tune with European stock markets. The high on October 28th coincided with the high in the Dow and S&P 500, but the trading range in Toronto has much more of a downward tilt to it than the New York market. Still, we think a retracement here is healthy and we should see a return to rally within a week. But, watch the NY and London markets for leading indicators.

Australian Dollar: http://www.marketclues.net/cgi-bin/myclues?chart=/:/futures/d/ad_a0.4903.html&member=wcorney@keatepartners.com

The A$ attempted to rally along with the Euro, but fell back on Thursday, returning to the long term trendlines which have characterized its bear market rally recently.

Commercials were extremely bearish the last time we mentioned them, but this week they reached new highs in bearishness. Commercials now hold only 2,837 contracts long versus 33,286 contracts short. That's an increase of 3270 net short contracts. Moreover, large traders do not hold a single contract short! Most telling of all for the coming crash in the A$ is the position of small traders: 21,075 long to only 3,240 short. When the hot money gets going, so will the A$ — to the downside. Which is, after all, good news.

Australian All Ordinaries: http://www.marketclues.net/cgi-bin/myclues?chart=/:/indices/d/_aord.4903.html&member=wcorney@keatepartners.com

Although caught in a trading range all week, the All-Ordinaries weren't able to make their high on Monday, October 28th — they peaked the previous Thursday, the 24th. Still, late week highs were within a few points of the prior week's high, so the pattern is close enough to the US market to suspect that we're only halfway through this overall trend rally from October 10th.
Australia Business News http://www.abc.net.au/news/business/default.htm
Yahoo! Australia Business News http://au.dailynews.yahoo.com/Full_Coverage/Australian_Economy/

London Financial-Times 100: http://www.marketclues.net/cgi-bin/myclues?chart=/:/indices/d/_ftse.4903.html&member=wcorney@keatepartners.com

The FTSE has been much weaker than the US markets. However, we should point out that the London market bottomed well ahead of the US market, on the 24th of September versus the 10th of October. The retracement so far has erased almost half of the prior rally's gains. If the US market does the same, it would bode well for further rally thereafter. Watch the London market for an upturn — it may continue to serve as a good leading indicator for the other stock markets.

Gold Stocks: http://www.marketclues.net/cgi-bin/myclues?chart=/:/indices/d/_xau.4903.html&member=wcorney@keatepartners.com

The XAU has been bottled up in an overarching polytrend resistance line since June. Last week, the first sign of a breakout started appearing. This doesn't change the trend to up, however, and we'll need to see more strength to suggest an imminent uptrend.

Suggested reading: ``Gold Lives in a Cage'', a new article by Craig Harris of Harris Capital Management, Inc. CTA. Craig describes himself as a ``reluctant bull'' on gold. ("http://www.321gold.com/editorials/harris/harris103102.html")

Bonds / Interest Rates:

Bonds continue to correct their recent rally, but should provide an excellent haven from stock market weakness.

Target 2030 Zero Coupon Bond Fund Quote

Sectors and Individual Stocks (Subscribers Only)

For tables ranking sectors and individual stocks, and links to charts of 3500 individual stocks and sectors, please visit your very own MyClues Home Page[http://www.marketclues.net/cgi-bin/myclues?myhome=yes&member=@@] -- in the CHARTS & RESEARCH section of the page, you will find a wealth of tools for selecting top sectors and stocks, including access to our exclusive realtime, intraday indicators.

For a 3-4 month free trial subscription, click here.

Commodities (Subscribers Only)

For complete charts of commodities, please visit your very own MyClues Home Page[http://www.marketclues.net/cgi-bin/myclues?myhome=yes&member=@@] -- in the CHARTS & RESEARCH section of the page, you will find links to webpages containing links to the following:

For a 3-4 month free trial subscription, click here.

CRB Index: http://www.marketclues.net/cgi-bin/myclues?chart=/:/futures/d/cr_a0.4903.html&member=wcorney@keatepartners.com

Commodities are continuing to adhere to the long support line they've developed on both the daily and weekly charts. This continues to be an excellent argument against deflation.

Copper: http://www.marketclues.net/cgi-bin/myclues?chart=/:/futures/d/hg_z2.4903.html&member=wcorney@keatepartners.com

Copper punched through resistance at the prior 4th wave high and moved close to the 50% retracement price of 73.02¢ (the high was made on Friday at 72.9¢). Further resistance is at the 62% retracement price of 74.76¢. The jury is out on this one, but we still lean toward the bearish case: demand for copper depends to a large extent on the housing industry, which shows strong signs of slowing demand right now. We count the current rally as wave A in a bear market rally. Still, this rally is another good argument against deflation.

Format for printing. [Go back]

For Friday, November 1, 2002
© Bob Carver
$-Weighted OEX/QQQ Call/Put Ratios: See Website
Popular Indices: http://www.marketclues.net/cgi-bin/myclues?chart=/:/indices/d/_spx.4903.html&member=@@ ^SPX · http://www.marketclues.net/cgi-bin/myclues?chart=/:/indices/d/_compq.4903.html&member=@@ ^IXQ · http://www.marketclues.net/cgi-bin/myclues?chart=/:/indices/d/_ndx.4903.html&member=@@ ^NDX · http://www.marketclues.net/cgi-bin/myclues?chart=/:/indices/d/_dj.4903.html&member=@@ ^DJI · http://www.marketclues.net/cgi-bin/myclues?chart=/:/indices/d/_mid.4903.html&member=@@ ^MID · http://www.marketclues.net/cgi-bin/myclues?chart=/:/indices/d/_oex.4903.html&member=@@ ^OEX · http://www.marketclues.net/cgi-bin/myclues?chart=/:/indices/d/_nya.4903.html&member=@@ ^NYA · http://www.marketclues.net/cgi-bin/myclues?chart=/:/indices/d/_vle.4903.html&member=@@ ^VLE · http://www.marketclues.net/cgi-bin/myclues?chart=/:/indices/d/_rut.4903.html&member=@@ ^RUT · http://www.marketclues.net/cgi-bin/myclues?chart=/:/indices/d/_sml.4903.html&member=@@ ^SML · http://www.marketclues.net/cgi-bin/myclues?chart=/:/futures/d/cr_a0.4903.html&member=@@ ^CRB · http://www.marketclues.net/cgi-bin/myclues?chart=/:/indices/d/_xau.4903.html&member=@@ ^XAU · http://www.marketclues.net/cgi-bin/myclues?chart=/:/indices/d/_btk.4903.html&member=@@ ^BTK · http://www.marketclues.net/cgi-bin/myclues?chart=/:/indices/d/_tyx.4903.html&member=@@ ^TYX
Sector Performance Since: 8 Apr 1999 · 18 Oct 1999 · A Week Ago · A Fortnight Ago
Sector Acceleration Since: 8 Apr 1999 · 18 Oct 1999 · A Week Ago · A Fortnight Ago

MyClues Home Page Link ("http://www.marketclues.net/cgi-bin/myclues?myhome=yes&member;[email protected]")

Got Stocks? Do you have money in the stock market? If so, you need to read this valuable excerpt from Chapter 20 of Bob Prechter's new book, Conquer the Crash. By now, you should be familiar with Bob's long-term forecast for stocks - namely, there's still a LONG way to go in this bear market. In this excerpt, Bob offers advice on stocks, mutual funds, short-selling, diversifying, and more. To be fully prepared for the bear market, you need to read all of Conquer the Crash and act on Bob's advice. But, the information you are about to read is a great start.

Stocks: Hallowe'en Window Dressing

The buyers kept up the pressure to close the market at high levels on Thursday as the end of the best month of gains for the stock market since January 1987 came to a close. The bears are ready for the ride down, though, and were selling every intraday rally attempt. The QQQ traders, who may have inside information to guide their purchases of NASDAQ-100 options, were heavily pouring money into puts (bets the market would go down). We have noted recently that these option players, unlike their OEX cousins, are more often correct than wrong.

We're in the middle of what would normally be the Monthly Buying Spree, but recent activities seem to have sapped much of the buying strength early (sort of like the 0% auto financing offers sapped much of 2003 buying strength for automobiles).

We put cash to work Wednesday and bought bonds for the short term, awaiting a big buying opportunity upcoming in stocks if we get that big retracement we're looking for.

Note: detailed comments will be found on our Detailed Comments Page.

Fixed Income Exchange-Traded Funds We have summarized the fixed-income exchange-traded funds in this page ("http://www.marketclues.net/clues/fixedincomeetfs.html"). These make a good place to invest during weak periods in the stock market. They have the advantage of stocks (they can be traded when the market is open) and move in the opposite direction.

Format for printing. [Go back]

For Thursday, October 31, 2002
© Bob Carver
$-Weighted OEX/QQQ Call/Put Ratios: See Website
Popular Indices: http://www.marketclues.net/cgi-bin/myclues?chart=/:/indices/d/_spx.4903.html&member=@@ ^SPX · http://www.marketclues.net/cgi-bin/myclues?chart=/:/indices/d/_compq.4903.html&member=@@ ^IXQ · http://www.marketclues.net/cgi-bin/myclues?chart=/:/indices/d/_ndx.4903.html&member=@@ ^NDX · http://www.marketclues.net/cgi-bin/myclues?chart=/:/indices/d/_dj.4903.html&member=@@ ^DJI · http://www.marketclues.net/cgi-bin/myclues?chart=/:/indices/d/_mid.4903.html&member=@@ ^MID · http://www.marketclues.net/cgi-bin/myclues?chart=/:/indices/d/_oex.4903.html&member=@@ ^OEX · http://www.marketclues.net/cgi-bin/myclues?chart=/:/indices/d/_nya.4903.html&member=@@ ^NYA · http://www.marketclues.net/cgi-bin/myclues?chart=/:/indices/d/_vle.4903.html&member=@@ ^VLE · http://www.marketclues.net/cgi-bin/myclues?chart=/:/indices/d/_rut.4903.html&member=@@ ^RUT · http://www.marketclues.net/cgi-bin/myclues?chart=/:/indices/d/_sml.4903.html&member=@@ ^SML · http://www.marketclues.net/cgi-bin/myclues?chart=/:/futures/d/cr_a0.4903.html&member=@@ ^CRB · http://www.marketclues.net/cgi-bin/myclues?chart=/:/indices/d/_xau.4903.html&member=@@ ^XAU · http://www.marketclues.net/cgi-bin/myclues?chart=/:/indices/d/_btk.4903.html&member=@@ ^BTK · http://www.marketclues.net/cgi-bin/myclues?chart=/:/indices/d/_tyx.4903.html&member=@@ ^TYX
Sector Performance Since: 8 Apr 1999 · 18 Oct 1999 · A Week Ago · A Fortnight Ago
Sector Acceleration Since: 8 Apr 1999 · 18 Oct 1999 · A Week Ago · A Fortnight Ago

MyClues Home Page Link ("http://www.marketclues.net/cgi-bin/myclues?myhome=yes&member;[email protected]")

Got Stocks? Do you have money in the stock market? If so, you need to read this valuable excerpt from Chapter 20 of Bob Prechter's new book, Conquer the Crash. By now, you should be familiar with Bob's long-term forecast for stocks - namely, there's still a LONG way to go in this bear market. In this excerpt, Bob offers advice on stocks, mutual funds, short-selling, diversifying, and more. To be fully prepared for the bear market, you need to read all of Conquer the Crash and act on Bob's advice. But, the information you are about to read is a great start.

Stocks: Very Toppy Market

The market moved higher Wednesday as end of month buying pressure helped the market recover. However, due to a number of technical factors, this rally probably has made a near term ceiling and the beginning of a stiff decline into mid-month.

We emailed subscribers to our Notification List (a self-service list which can be found on your MyClues Page on the Special Reports header bar) and liquidated our holdings Wednesday afternoon in order to assess our next move. As we like to say, ``When in doubt, get out.'' It's something most investors should do. It's always better to view the market from a stable platform, such as cash, to get a good perspective (it's especially good to be able to view the market from cash when you've just taken a good profit!).

The Bradley Calendar has now (almost assuredly) nailed the last four turns in the market, the latest being Monday's high. The next turn in that calendar comes little more than a week from today, so we are likely to find a good buying opportunity in the near future.

We're counting this corrective wave as B, the middle down wave within an ABC rally which started in early October. Once wave B bottoms and wave C begins, the upside should be explosive. Until that buying opportunity comes, however, we're play defense in this overall bear market rally — even if we do think a 50% rise off the October low is very likely.

Note: detailed comments will be found on our Detailed Comments Page.

Fixed Income Exchange-Traded Funds We have summarized the fixed-income exchange-traded funds in this page ("http://www.marketclues.net/clues/fixedincomeetfs.html"). These make a good place to invest during weak periods in the stock market. They have the advantage of stocks (they can be traded when the market is open) and move in the opposite direction.

Format for printing. [Go back]

For Wednesday, October 30, 2002
© Bob Carver
$-Weighted OEX/QQQ Call/Put Ratios: 0.67/1.05
Popular Indices: http://www.marketclues.net/cgi-bin/myclues?chart=/:/indices/d/_spx.4903.html&member=@@ ^SPX · http://www.marketclues.net/cgi-bin/myclues?chart=/:/indices/d/_compq.4903.html&member=@@ ^IXQ · http://www.marketclues.net/cgi-bin/myclues?chart=/:/indices/d/_ndx.4903.html&member=@@ ^NDX · http://www.marketclues.net/cgi-bin/myclues?chart=/:/indices/d/_dj.4903.html&member=@@ ^DJI · http://www.marketclues.net/cgi-bin/myclues?chart=/:/indices/d/_mid.4903.html&member=@@ ^MID · http://www.marketclues.net/cgi-bin/myclues?chart=/:/indices/d/_oex.4903.html&member=@@ ^OEX · http://www.marketclues.net/cgi-bin/myclues?chart=/:/indices/d/_nya.4903.html&member=@@ ^NYA · http://www.marketclues.net/cgi-bin/myclues?chart=/:/indices/d/_vle.4903.html&member=@@ ^VLE · http://www.marketclues.net/cgi-bin/myclues?chart=/:/indices/d/_rut.4903.html&member=@@ ^RUT · http://www.marketclues.net/cgi-bin/myclues?chart=/:/indices/d/_sml.4903.html&member=@@ ^SML · http://www.marketclues.net/cgi-bin/myclues?chart=/:/futures/d/cr_a0.4903.html&member=@@ ^CRB · http://www.marketclues.net/cgi-bin/myclues?chart=/:/indices/d/_xau.4903.html&member=@@ ^XAU · http://www.marketclues.net/cgi-bin/myclues?chart=/:/indices/d/_btk.4903.html&member=@@ ^BTK · http://www.marketclues.net/cgi-bin/myclues?chart=/:/indices/d/_tyx.4903.html&member=@@ ^TYX
Sector Performance Since: 8 Apr 1999 · 18 Oct 1999 · A Week Ago · A Fortnight Ago
Sector Acceleration Since: 8 Apr 1999 · 18 Oct 1999 · A Week Ago · A Fortnight Ago

MyClues Home Page Link ("http://www.marketclues.net/cgi-bin/myclues?myhome=yes&member;[email protected]")

Got Stocks? Do you have money in the stock market? If so, you need to read this valuable excerpt from Chapter 20 of Bob Prechter's new book, Conquer the Crash. By now, you should be familiar with Bob's long-term forecast for stocks - namely, there's still a LONG way to go in this bear market. In this excerpt, Bob offers advice on stocks, mutual funds, short-selling, diversifying, and more. To be fully prepared for the bear market, you need to read all of Conquer the Crash and act on Bob's advice. But, the information you are about to read is a great start.

Stocks: A Sentimental Turnaround

Tuesday has a reputation of being a turnaround day and this one proved to be a double turnaround. Initially, the market sold off on the plunge in consumer sentiment. Now, consumer sentiment is a lagging indicator and with the economy moving into its third year of recession, that segment is throwing in the towel. That shouldn't have been news to the market, but it caused a huge plunge.

What happened was that buyers cancelled their bids for stocks and the hedge funds came in to sell stocks short. With no buyers, the vacuum under the market created a big downdraft.

Later in the day, the selling pressure dried up and the buyers returned, sending the market right back up to a positive close. In other words, lots of sound and fury with no substance whatsoever. But, that's the nature of the market right now as the correction which started after the 16th continues. We expect it to continue for another week or so, but we also expect a higher high in the next few days as the Monthly Buying Spree shifts into high gear.

Despite an expected dip to retrace some of the Oct. 10-16 rally, we expect much higher prices on the indices for quite a while to come.

Note: detailed comments will be found on our Detailed Comments Page.

Fixed Income Exchange-Traded Funds We have summarized the fixed-income exchange-traded funds in this page ("http://www.marketclues.net/clues/fixedincomeetfs.html"). These make a good place to invest during weak periods in the stock market. They have the advantage of stocks (they can be traded when the market is open) and move in the opposite direction.

Format for printing. [Go back]

For Tuesday, October 29, 2002
© Bob Carver
$-Weighted OEX/QQQ Call/Put Ratios: See Website
Popular Indices: http://www.marketclues.net/cgi-bin/myclues?chart=/:/indices/d/_spx.4903.html&member=@@ ^SPX · http://www.marketclues.net/cgi-bin/myclues?chart=/:/indices/d/_compq.4903.html&member=@@ ^IXQ · http://www.marketclues.net/cgi-bin/myclues?chart=/:/indices/d/_ndx.4903.html&member=@@ ^NDX · http://www.marketclues.net/cgi-bin/myclues?chart=/:/indices/d/_dj.4903.html&member=@@ ^DJI · http://www.marketclues.net/cgi-bin/myclues?chart=/:/indices/d/_mid.4903.html&member=@@ ^MID · http://www.marketclues.net/cgi-bin/myclues?chart=/:/indices/d/_oex.4903.html&member=@@ ^OEX · http://www.marketclues.net/cgi-bin/myclues?chart=/:/indices/d/_nya.4903.html&member=@@ ^NYA · http://www.marketclues.net/cgi-bin/myclues?chart=/:/indices/d/_vle.4903.html&member=@@ ^VLE · http://www.marketclues.net/cgi-bin/myclues?chart=/:/indices/d/_rut.4903.html&member=@@ ^RUT · http://www.marketclues.net/cgi-bin/myclues?chart=/:/indices/d/_sml.4903.html&member=@@ ^SML · http://www.marketclues.net/cgi-bin/myclues?chart=/:/futures/d/cr_a0.4903.html&member=@@ ^CRB · http://www.marketclues.net/cgi-bin/myclues?chart=/:/indices/d/_xau.4903.html&member=@@ ^XAU · http://www.marketclues.net/cgi-bin/myclues?chart=/:/indices/d/_btk.4903.html&member=@@ ^BTK · http://www.marketclues.net/cgi-bin/myclues?chart=/:/indices/d/_tyx.4903.html&member=@@ ^TYX
Sector Performance Since: 8 Apr 1999 · 18 Oct 1999 · A Week Ago · A Fortnight Ago
Sector Acceleration Since: 8 Apr 1999 · 18 Oct 1999 · A Week Ago · A Fortnight Ago

MyClues Home Page Link ("http://www.marketclues.net/cgi-bin/myclues?myhome=yes&member;[email protected]")

Got Stocks? Do you have money in the stock market? If so, you need to read this valuable excerpt from Chapter 20 of Bob Prechter's new book, Conquer the Crash. By now, you should be familiar with Bob's long-term forecast for stocks - namely, there's still a LONG way to go in this bear market. In this excerpt, Bob offers advice on stocks, mutual funds, short-selling, diversifying, and more. To be fully prepared for the bear market, you need to read all of Conquer the Crash and act on Bob's advice. But, the information you are about to read is a great start.

Stocks: Pre-Spree Weakness

The market couldn't advance Monday with the weight of too many bulls on its back. More than twice as much money went into upside bets in options and that helped drag the market lower.

However, we have leading sectors which are still working their way higher. These leading sectors are still extremely oversold on a long term basis and have good potential to rise over the next month.

Because of the potential for a deeper pullback later in the week, we may switch between stocks and bonds at some point this week (if you are on the Notification List, you will receive an email notification — this is a self-service email notification list you can add yourself to and delete yourself from by clicking on the links in the Special Reports header bar on your MyClues Home Page). This is especially the case because the Bradley Calendar warns that Monday the 28th of October marks the center date for a minor trend change (a turn down in this case) and a move lower in the 8th of November. We need confirmation from our coincident indicators before switching, however.

Note: more detailed comments will be found on our Detailed Comments Page.

Fixed Income Exchange-Traded Funds: We have summarized the fixed-income exchange-traded funds in this page ("http://www.marketclues.net/clues/fixedincomeetfs.html"). These make a good place to invest during weak periods in the stock market. They have the advantage of stocks (they can be traded when the market is open) and move in the opposite direction.

Format for printing. [Go back]

For Monday, October 28, 2002
© Bob Carver
$-Weighted OEX/QQQ Call/Put Ratios: 1.61/1.15
Popular Indices: http://www.marketclues.net/cgi-bin/myclues?chart=/:/indices/d/_spx.4903.html&member=@@ ^SPX · http://www.marketclues.net/cgi-bin/myclues?chart=/:/indices/d/_compq.4903.html&member=@@ ^IXQ · http://www.marketclues.net/cgi-bin/myclues?chart=/:/indices/d/_ndx.4903.html&member=@@ ^NDX · http://www.marketclues.net/cgi-bin/myclues?chart=/:/indices/d/_dj.4903.html&member=@@ ^DJI · http://www.marketclues.net/cgi-bin/myclues?chart=/:/indices/d/_mid.4903.html&member=@@ ^MID · http://www.marketclues.net/cgi-bin/myclues?chart=/:/indices/d/_oex.4903.html&member=@@ ^OEX · http://www.marketclues.net/cgi-bin/myclues?chart=/:/indices/d/_nya.4903.html&member=@@ ^NYA · http://www.marketclues.net/cgi-bin/myclues?chart=/:/indices/d/_vle.4903.html&member=@@ ^VLE · http://www.marketclues.net/cgi-bin/myclues?chart=/:/indices/d/_rut.4903.html&member=@@ ^RUT · http://www.marketclues.net/cgi-bin/myclues?chart=/:/indices/d/_sml.4903.html&member=@@ ^SML · http://www.marketclues.net/cgi-bin/myclues?chart=/:/futures/d/cr_a0.4903.html&member=@@ ^CRB · http://www.marketclues.net/cgi-bin/myclues?chart=/:/indices/d/_xau.4903.html&member=@@ ^XAU · http://www.marketclues.net/cgi-bin/myclues?chart=/:/indices/d/_btk.4903.html&member=@@ ^BTK · http://www.marketclues.net/cgi-bin/myclues?chart=/:/indices/d/_tyx.4903.html&member=@@ ^TYX
Sector Performance Since: 8 Apr 1999 · 18 Oct 1999 · A Week Ago · A Fortnight Ago
Sector Acceleration Since: 8 Apr 1999 · 18 Oct 1999 · A Week Ago · A Fortnight Ago

MyClues Home Page Link ("http://www.marketclues.net/cgi-bin/myclues?myhome=yes&member;[email protected]")

Got Stocks? Do you have money in the stock market? If so, you need to read this valuable excerpt from Chapter 20 of Bob Prechter's new book, Conquer the Crash. By now, you should be familiar with Bob's long-term forecast for stocks - namely, there's still a LONG way to go in this bear market. In this excerpt, Bob offers advice on stocks, mutual funds, short-selling, diversifying, and more. To be fully prepared for the bear market, you need to read all of Conquer the Crash and act on Bob's advice. But, the information you are about to read is a great start.

Stocks: A Seasonal Rally

After a monster rally off the October 10th low (it was two days earlier, October 8th, in our ``lead-dog'' index, the NASDAQ-100 — and that two-day warning is what we see on average from our lead dog), the market entered a correction last week. So far, we have seen a modest selloff in the Dow and S&P 500, but strength in the Semiconductors and NASDAQ-100, which is bullish for the future.

Signs of strength in NASDAQ, as well as weakness in bonds, triggered us to switch between bonds and stocks on Friday afternoon. At this seasonally strong period of the year for stocks, we have to be sensitive to the fact that momentum traders and mutual funds are anxious to buy the market for the year-end rally.

During this correction we switched into bonds for safety and enjoyed a nice rally in our Fixed Income Exchange-Traded Funds. (We have summarized the fixed-income exchange-traded funds in this page: "http://www.marketclues.net/clues/fixedincomeetfs.html".) These make a good place to invest during weak periods in the stock market. They have the advantage of stocks (they can be traded when the market is open) and move in the opposite direction.

While we have switched investments around a bit in the last week (and, by the way, sidestepped the stock correction and made some short term profits in the bond market), we believe that within the context of the worst long term bear market since the Great Depression, utmost caution in stock investments is very important, especially since the evidence says that the current rally is not to be trusted too far or too long. In fact, so far the rally has the internal technical appearance of a bear market rally. That doesn't keep us from being aboard when we think the trend is up, but we will switch investment horses whenever weakness in stocks appears (and, whenever the market shows signs of rallying, we're quick to switch back into stocks via index funds, such as exchange-traded funds).

Next week should be both interesting and challenging. The end of month period typically sees some weakness in the market. However, the strongest period of the month tends to start on the next-to-last trading day of the month and end on the third trading day of the next month. This month that period, which we whimsically call the Monthly Buying Spree because that's when mutual funds typically put new investment cash to work, starts on Wednesday. Couple this seasonally strong period of the month with this seasonally strong quarter of the year and you tend to get lasting rallies.

Detailed commentary on the stock market continues on our Extended Comments Page ("http://www.marketclues.net/cgi-bin/myclues?trading=20&member;[email protected]").

Euro Currency: http://www.marketclues.net/cgi-bin/myclues?chart=/:/futures/d/ec_a0.4903.html&member=wcorney@keatepartners.com

The Euro continues to trade sideways. Commercials are still bearish, with only 27,771 bullish contracts versus 63,866 contracts sold short as of last Tuesday on the Chicago Mercantile Exchange. However, that was a reduction of 8,389 short contracts and a reduction of only 59 long contracts from the preceding week, so the commercials are growing slightly less bearish. Still, the most likely direction for a breakout from the range is clearly to the downside given that the huge runup earlier in the year has yet to be corrected and the likely break out of a narrowing trading range is in the same direction it was entered (down).

U.S. Dollar Index: http://www.marketclues.net/cgi-bin/myclues?chart=/:/futures/d/dx_a0.4903.html&member=wcorney@keatepartners.com

The Dollar Index continues a similar pattern as the Euro: sideways. Since the Dollar and the Euro are inversely related, we expect the Dollar to break up out of the pattern.

Canadian Dollar: http://www.marketclues.net/cgi-bin/myclues?chart=/:/futures/d/cd_a0.4903.html&member=wcorney@keatepartners.com

The Canadian Dollar has a bearish trend. We count the current rally as a wave C within a countertrend wave 2 rally, to be followed by a wave 3 to the downside once it completes. That bearish analysis is confirmed by commercial interests which are long (bullish) 16,873 contracts but short (bearish) a more impressive total of 39,931 contracts. That's a decrease of 3,269 long contracts and an increase of 7,226 short contracts from the week before.

S&P Toronto Stock Exchange http://www.marketclues.net/cgi-bin/myclues?chart=/:/indices/d/_sptse.4903.html&member=wcorney@keatepartners.com

The TSE moved above the centerline of its broad trading channel, as well as above its June-September downtrend resistance line, confirming the uptrend. Last week's consolidation should follow the pattern of Wall Street, moving higher once the correction is finished.

Australian Dollar: http://www.marketclues.net/cgi-bin/myclues?chart=/:/futures/d/ad_a0.4903.html&member=wcorney@keatepartners.com

We're still bearish the Aussie Dollar as it continues tracking some old trendlines higher. Commercials are even more bearish than last time with only 3,227 contracts held long to 30,406 held short. That's a meager increase of 16 long contracts from the previous week to an increase of 8,956 short contracts! The pattern is similar to the Canadian Dollar — five waves down and now a three-wave rally. The reasons why this is good for most folks was laid out last week, so we won't repeat that here.

Australian All Ordinaries: http://www.marketclues.net/cgi-bin/myclues?chart=/:/indices/d/_aord.4903.html&member=wcorney@keatepartners.com

The All-Ords held pretty much within the previous week's range as it consolidates ahead of further gains. We did get a breakout through the downtrend channel and a pullback to test the breakout. The strength in the dollar may be sapping stock market strength. During the long decline in the dollar from 1996, the Australian stock market was one of the strongest in the world. The stock market decline from March roughly corresponds to the period of strength we saw in the dollar. Once the dollar resumes its downtrend, it should help the Australian stock market.
Australia Business News http://www.abc.net.au/news/business/default.htm
Yahoo! Australia Business News http://au.dailynews.yahoo.com/Full_Coverage/Australian_Economy/

London Financial-Times 100: http://www.marketclues.net/cgi-bin/myclues?chart=/:/indices/d/_ftse.4903.html&member=wcorney@keatepartners.com

The London market was ahead of Wall Street in recovery from the slide and was ahead again last week, correcting the big October rally. With stocks expected to finish the correction soon on Wall Street, will the London market lead the way? We suspect it will.

Bonds / Interest Rates: Benefitting From Stock Weakness

Note: extended bond market comments will be found on our Extended Comments Page.

Target 2030 Zero Coupon Bond Fund Quote

Sectors and Individual Stocks (Subscribers Only)

For tables ranking sectors and individual stocks, and links to charts of 3500 individual stocks and sectors, please visit your very own MyClues Home Page[http://www.marketclues.net/cgi-bin/myclues?myhome=yes&member=@@] -- in the CHARTS & RESEARCH section of the page, you will find a wealth of tools for selecting top sectors and stocks, including access to our exclusive realtime, intraday indicators.

For a 3-4 month free trial subscription, click here.

Commodities (Subscribers Only)

For complete charts of commodities, please visit your very own MyClues Home Page[http://www.marketclues.net/cgi-bin/myclues?myhome=yes&member=@@] -- in the CHARTS & RESEARCH section of the page, you will find links to webpages containing links to the following:

For a 3-4 month free trial subscription, click here.

CRB Index: http://www.marketclues.net/cgi-bin/myclues?chart=/:/futures/d/cr_a0.4903.html&member=wcorney@keatepartners.com

The good news is that the CRB Index is in an uptrend, which bodes well for stocks. That is, companies should have pricing power based upon a slightly positive inflation rate, rather than having to battle against the headwinds of deflation.

Copper: http://www.marketclues.net/cgi-bin/myclues?chart=/:/futures/d/hg_z2.4903.html&member=wcorney@keatepartners.com

Five waves up in Copper and the metal finished the week very near the previous 4th wave high from the recent downtrend. This should be resistance. If the rally, wave a, breaks down, we could see a wave b correction giving back some of the gains so far. If, however, the rally is able to penetrate wave 4, look for it to run to the halfway retracement (73¢ in Dec Copper).

Format for printing. [Go back]

For Friday, October 25, 2002
© Bob Carver
$-Weighted OEX/QQQ Call/Put Ratios: 0.76/0.43
Popular Indices: http://www.marketclues.net/cgi-bin/myclues?chart=/:/indices/d/_spx.4903.html&member=@@ ^SPX · http://www.marketclues.net/cgi-bin/myclues?chart=/:/indices/d/_compq.4903.html&member=@@ ^IXQ · http://www.marketclues.net/cgi-bin/myclues?chart=/:/indices/d/_ndx.4903.html&member=@@ ^NDX · http://www.marketclues.net/cgi-bin/myclues?chart=/:/indices/d/_dj.4903.html&member=@@ ^DJI · http://www.marketclues.net/cgi-bin/myclues?chart=/:/indices/d/_mid.4903.html&member=@@ ^MID · http://www.marketclues.net/cgi-bin/myclues?chart=/:/indices/d/_oex.4903.html&member=@@ ^OEX · http://www.marketclues.net/cgi-bin/myclues?chart=/:/indices/d/_nya.4903.html&member=@@ ^NYA · http://www.marketclues.net/cgi-bin/myclues?chart=/:/indices/d/_vle.4903.html&member=@@ ^VLE · http://www.marketclues.net/cgi-bin/myclues?chart=/:/indices/d/_rut.4903.html&member=@@ ^RUT · http://www.marketclues.net/cgi-bin/myclues?chart=/:/indices/d/_sml.4903.html&member=@@ ^SML · http://www.marketclues.net/cgi-bin/myclues?chart=/:/futures/d/cr_a0.4903.html&member=@@ ^CRB · http://www.marketclues.net/cgi-bin/myclues?chart=/:/indices/d/_xau.4903.html&member=@@ ^XAU · http://www.marketclues.net/cgi-bin/myclues?chart=/:/indices/d/_btk.4903.html&member=@@ ^BTK · http://www.marketclues.net/cgi-bin/myclues?chart=/:/indices/d/_tyx.4903.html&member=@@ ^TYX
Sector Performance Since: 8 Apr 1999 · 18 Oct 1999 · A Week Ago · A Fortnight Ago
Sector Acceleration Since: 8 Apr 1999 · 18 Oct 1999 · A Week Ago · A Fortnight Ago

MyClues Home Page Link ("http://www.marketclues.net/cgi-bin/myclues?myhome=yes&member;[email protected]")

Got Stocks? Do you have money in the stock market? If so, you need to read this valuable excerpt from Chapter 20 of Bob Prechter's new book, Conquer the Crash. By now, you should be familiar with Bob's long-term forecast for stocks - namely, there's still a LONG way to go in this bear market. In this excerpt, Bob offers advice on stocks, mutual funds, short-selling, diversifying, and more. To be fully prepared for the bear market, you need to read all of Conquer the Crash and act on Bob's advice. But, the information you are about to read is a great start.

Errata

We had a bad link in yesterday's email. Here's a link to the 1932 SPX chart ("http://www.marketclues.net/img/_spx1932.gif") in case you missed it.

Stocks: Topping Action

Note: more specific short term — as well as long term — comments will be found on our
Trading Comments Page.

As expected, the stock market is putting in a top here and declined sharply on Thursday. Our move into fixed-income exchange-traded funds garnered us a nice move up in paper value on the stock market weakness. We have added a page which describes these kinds of stocks in the link at the bottom of this update.

Because sentiment has turned bearish, we don't think the stock market will correct straight down from here. In fact, another test of that upper polytrendline channel in the various indices is entirely likely before we get much more.

We've mentioned the Bradley Calendar before. It has absolutely nailed the last three turning points in the stock market and seems to be on track with this one. The next turning point on that calendar is Monday, October 28th ±2 trading days, which makes Thursday (today) the first day of that turning point window. Now, we have already cautioned you that such forecasting indicators are nice, but have to be confirmed by coincident indicators. The coincident indicator classes we like to use fall in these categories:

  1. Sentiment

  2. Price Momentum

  3. Money Flow

  4. Elliott Wave

Within each category, there are several flavors, but it generally doesn't pay a great deal more to use too many of the same indicators within a category (the Law of Diminishing Returns applies). That's because they are essentially overlapping each other in what they are measuring. For instance, in the Price Momentum category, you might have our Accumulation-Distribution Oscillator, Stochastics, RSI, MACD, et al. However, you should really count all those indicators as measuring almost the same attribute: price rate-of-change. Thus, confirmation must be sought across the categories of indicators, rather than only a single category.

In the real world, however, indicators don't always agree. Right now, sentiment says traders are turning bearish too quickly and that tells us that we may have further probes to the top of the topping channel. Money Flow had been strong until Thursday, which confirms the turn toward more of a downward trend. Elliott Wave has told us of a completed pattern to the upside, which is bearish short term (although, on a longer term basis, this indicator is actually bullish).

IEF, the Lehman 7-10 year bond fund ETF, had a good day Thursday, rising over ½%.

Fixed Income Exchange-Traded Funds link. We have summarized the fixed-income exchange-traded funds in this page ("http://www.marketclues.net/clues/fixedincomeetfs.html"). These make a good place to invest during weak periods in the stock market. They have the advantage of stocks (they can be traded when the market is open) and move in the opposite direction.

Format for printing. [Go back]

For Thursday, October 24, 2002
© Bob Carver
$-Weighted OEX/QQQ Call/Put Ratios: 1.06/3.36
Popular Indices: http://www.marketclues.net/cgi-bin/myclues?chart=/:/indices/d/_spx.4903.html&member=@@ ^SPX · http://www.marketclues.net/cgi-bin/myclues?chart=/:/indices/d/_compq.4903.html&member=@@ ^IXQ · http://www.marketclues.net/cgi-bin/myclues?chart=/:/indices/d/_ndx.4903.html&member=@@ ^NDX · http://www.marketclues.net/cgi-bin/myclues?chart=/:/indices/d/_dj.4903.html&member=@@ ^DJI · http://www.marketclues.net/cgi-bin/myclues?chart=/:/indices/d/_mid.4903.html&member=@@ ^MID · http://www.marketclues.net/cgi-bin/myclues?chart=/:/indices/d/_oex.4903.html&member=@@ ^OEX · http://www.marketclues.net/cgi-bin/myclues?chart=/:/indices/d/_nya.4903.html&member=@@ ^NYA · http://www.marketclues.net/cgi-bin/myclues?chart=/:/indices/d/_vle.4903.html&member=@@ ^VLE · http://www.marketclues.net/cgi-bin/myclues?chart=/:/indices/d/_rut.4903.html&member=@@ ^RUT · http://www.marketclues.net/cgi-bin/myclues?chart=/:/indices/d/_sml.4903.html&member=@@ ^SML · http://www.marketclues.net/cgi-bin/myclues?chart=/:/futures/d/cr_a0.4903.html&member=@@ ^CRB · http://www.marketclues.net/cgi-bin/myclues?chart=/:/indices/d/_xau.4903.html&member=@@ ^XAU · http://www.marketclues.net/cgi-bin/myclues?chart=/:/indices/d/_btk.4903.html&member=@@ ^BTK · http://www.marketclues.net/cgi-bin/myclues?chart=/:/indices/d/_tyx.4903.html&member=@@ ^TYX
Sector Performance Since: 8 Apr 1999 · 18 Oct 1999 · A Week Ago · A Fortnight Ago
Sector Acceleration Since: 8 Apr 1999 · 18 Oct 1999 · A Week Ago · A Fortnight Ago

MyClues Home Page Link ("http://www.marketclues.net/cgi-bin/myclues?myhome=yes&member;[email protected]")

Stocks: Buying Pressure

The buy-the-dip mentality is back. Some of that sideline money is coming back into the market on the dip. However, we're counting this rally as a wave b within the correction and expect further dips to lower lows before the correction is over.

We've likened this rally to the cyclic bull market rally in 1932 in the chart above. The secular bear market which was in effect from 1929 to 1942 sent the market down 89%. But, right in the middle of that monstrous bear market, the 1932-1937 period saw one of the strongest cyclic bull markets of all time. The initial leg up after the July 1932 low saw the S&P 500 Index rise 111% in three months. If the current correction is wave 2, we have a powerful wave 3 ahead. However, that is yet to be seen and the potential for a lower low remains an ever-present threat to investors.

Wednesday's action was very constructive, however, and we like to see Money Flow as positive as it was on this dip.

Bonds did well until the stock market bounced off its lows. With additional stock market weakness likely, however, the bond market should bounce right back. And, we do think the stock market is going to see a steep selloff very soon. The likely turn date for a stock market bottom and a bond market top is given in our short term comment section linked below:

Note: more specific short term, as well as longer term, comments will be found on our Trading Comments Page.

Format for printing. [Go back]

For Wednesday, October 23, 2002
© Bob Carver
$-Weighted OEX/QQQ Call/Put Ratios: 0.75/0.96
Popular Indices: http://www.marketclues.net/cgi-bin/myclues?chart=/:/indices/d/_spx.4903.html&member=@@ ^SPX · http://www.marketclues.net/cgi-bin/myclues?chart=/:/indices/d/_compq.4903.html&member=@@ ^IXQ · http://www.marketclues.net/cgi-bin/myclues?chart=/:/indices/d/_ndx.4903.html&member=@@ ^NDX · http://www.marketclues.net/cgi-bin/myclues?chart=/:/indices/d/_dj.4903.html&member=@@ ^DJI · http://www.marketclues.net/cgi-bin/myclues?chart=/:/indices/d/_mid.4903.html&member=@@ ^MID · http://www.marketclues.net/cgi-bin/myclues?chart=/:/indices/d/_oex.4903.html&member=@@ ^OEX · http://www.marketclues.net/cgi-bin/myclues?chart=/:/indices/d/_nya.4903.html&member=@@ ^NYA · http://www.marketclues.net/cgi-bin/myclues?chart=/:/indices/d/_vle.4903.html&member=@@ ^VLE · http://www.marketclues.net/cgi-bin/myclues?chart=/:/indices/d/_rut.4903.html&member=@@ ^RUT · http://www.marketclues.net/cgi-bin/myclues?chart=/:/indices/d/_sml.4903.html&member=@@ ^SML · http://www.marketclues.net/cgi-bin/myclues?chart=/:/futures/d/cr_a0.4903.html&member=@@ ^CRB · http://www.marketclues.net/cgi-bin/myclues?chart=/:/indices/d/_xau.4903.html&member=@@ ^XAU · http://www.marketclues.net/cgi-bin/myclues?chart=/:/indices/d/_btk.4903.html&member=@@ ^BTK · http://www.marketclues.net/cgi-bin/myclues?chart=/:/indices/d/_tyx.4903.html&member=@@ ^TYX
Sector Performance Since: 8 Apr 1999 · 18 Oct 1999 · A Week Ago · A Fortnight Ago
Sector Acceleration Since: 8 Apr 1999 · 18 Oct 1999 · A Week Ago · A Fortnight Ago

MyClues Home Page Link ("http://www.marketclues.net/cgi-bin/myclues?myhome=yes&member;[email protected]")

Stocks: Trading Range Market

The market was trapped in a trading range Tuesday while short term traders turned moderately bearish. Those two attributes are a perfect fit after such a large rally and suggest that the correction, which could be a wave B within a larger degree ABC rally off the October 10th low, should cause the market to work sideways. If that's the case, a wave C rally should unfold during the month of November.

After capturing excellent profits from the recent runup in prices from the October 10th low, we moved to the sidelines near top tick Monday afternoon.

As of Tuesday, we've allocated funds to short term government bonds via the Exchange-Traded Fund with ticker symbol IEF, which is described as, ``The Lehman 7-10 Year US Treasury Index is a market capitalization weighted index, rebalanced monthly, designed to represent public obligations of the US Treasury that have a remaining maturity of between 7 and 10 years.'' If the correction does turn out to be a wave B rather than a plunge to retest recent lows, we will look for the next trading low to reallocate funds back into the stock market in order to capture gains from the expected wave C rally.

We realize that these short term moves may seem erratic to some investors. However, you must realize that we are dealing with a long term bear market. Navigating the shoals in a secular bear market demands a certain degree of caution that a secular bull market does not. It's best to reduce exposure to the market during periods of corrective activity and that's exactly what we're aiming for at this time. Whether the ultimate goal of this market is Dow 3500 or Dow 35,000, it's best to err on the side of caution until the signs of a strong bull market trend return.

Format for printing. [Go back]

For Tuesday, October 22, 2002
© Bob Carver
$-Weighted OEX/QQQ Call/Put Ratios: See Website
Popular Indices: http://clues.dhs.org:777/cgi-bin/myclues?chart=/:/indices/d/_spx.4903.html&member=@@ ^SPX · http://clues.dhs.org:777/cgi-bin/myclues?chart=/:/indices/d/_compq.4903.html&member=@@ ^IXQ · http://clues.dhs.org:777/cgi-bin/myclues?chart=/:/indices/d/_ndx.4903.html&member=@@ ^NDX · http://clues.dhs.org:777/cgi-bin/myclues?chart=/:/indices/d/_dj.4903.html&member=@@ ^DJI · http://clues.dhs.org:777/cgi-bin/myclues?chart=/:/indices/d/_mid.4903.html&member=@@ ^MID · http://clues.dhs.org:777/cgi-bin/myclues?chart=/:/indices/d/_oex.4903.html&member=@@ ^OEX · http://clues.dhs.org:777/cgi-bin/myclues?chart=/:/indices/d/_nya.4903.html&member=@@ ^NYA · http://clues.dhs.org:777/cgi-bin/myclues?chart=/:/indices/d/_vle.4903.html&member=@@ ^VLE · http://clues.dhs.org:777/cgi-bin/myclues?chart=/:/indices/d/_rut.4903.html&member=@@ ^RUT · http://clues.dhs.org:777/cgi-bin/myclues?chart=/:/indices/d/_sml.4903.html&member=@@ ^SML · http://clues.dhs.org:777/cgi-bin/myclues?chart=/:/futures/d/cr_a0.4903.html&member=@@ ^CRB · http://clues.dhs.org:777/cgi-bin/myclues?chart=/:/indices/d/_xau.4903.html&member=@@ ^XAU · http://clues.dhs.org:777/cgi-bin/myclues?chart=/:/indices/d/_btk.4903.html&member=@@ ^BTK · http://clues.dhs.org:777/cgi-bin/myclues?chart=/:/indices/d/_tyx.4903.html&member=@@ ^TYX
Sector Performance Since: 8 Apr 1999 · 18 Oct 1999 · A Week Ago · A Fortnight Ago
Sector Acceleration Since: 8 Apr 1999 · 18 Oct 1999 · A Week Ago · A Fortnight Ago

MyClues Home Page Link ("http://clues.dhs.org:777/cgi-bin/myclues?myhome=yes&member;[email protected]")

Note: Due to a DSL line outage, we have switched our server to the alternative address shown above temporarily.

Stocks: Raising the Flag

Note: more specific short term comments will be found on our
Trading Comments Page.

The market insiders decided to have a bit of fun with the shorts Monday and ran the flag up the pole: they jacked up stock prices to force those bears to buy — quite an ironic situation for smug bears who have had a rare winning year over the bulls this past year.

Actually, we suspect that the specialists on the floor of the New York Stock Exchange are pretty bearish themselves at the moment. By running prices up so quickly on low volume, it's clear that those insiders were supplying those shares out of thin air; i.e., they were selling them short. That doesn't bode well for the rally having any lasting significance other than enriching their bottom lines when they send share prices down to the sub-basement again.

In any case, this rally was fun while it lasted (and it might very well last into Turnaround Tuesday® afternoon), but we hopped off the train Monday afternoon — took our profits and moved to the sidelines for now. And, after a 21½% rally over the last eight sessions, this rally even qualifies as an ``official'' bull market!

We should, at the very least, get a stiff correction, if not a move to a new yearly low after the excesses of the past couple of weeks. The pattern is that of a bear market rally, forming an ABC upwave, despite the action Monday. If Prechter is right on his wave count, the next stop on the way down would be around Dow 4000 — not too far from our ultimate bear market low target of 3500-3600.

We will watch the action from the sidelines Tuesday. If you're on the Notification List, we'll notify you by email of any intraday moves. Note: more specific short term comments will be found on our Trading Comments Page.

Format for printing. [Go back]

For Monday, October 21, 2002
© Bob Carver
$-Weighted OEX/QQQ Call/Put Ratios: 1.21/0.85
Popular Indices: http://www.marketclues.net/cgi-bin/myclues?chart=/:/indices/d/_spx.4903.html&member=@@ ^SPX · http://www.marketclues.net/cgi-bin/myclues?chart=/:/indices/d/_compq.4903.html&member=@@ ^IXQ · http://www.marketclues.net/cgi-bin/myclues?chart=/:/indices/d/_ndx.4903.html&member=@@ ^NDX · http://www.marketclues.net/cgi-bin/myclues?chart=/:/indices/d/_dj.4903.html&member=@@ ^DJI · http://www.marketclues.net/cgi-bin/myclues?chart=/:/indices/d/_mid.4903.html&member=@@ ^MID · http://www.marketclues.net/cgi-bin/myclues?chart=/:/indices/d/_oex.4903.html&member=@@ ^OEX · http://www.marketclues.net/cgi-bin/myclues?chart=/:/indices/d/_nya.4903.html&member=@@ ^NYA · http://www.marketclues.net/cgi-bin/myclues?chart=/:/indices/d/_vle.4903.html&member=@@ ^VLE · http://www.marketclues.net/cgi-bin/myclues?chart=/:/indices/d/_rut.4903.html&member=@@ ^RUT · http://www.marketclues.net/cgi-bin/myclues?chart=/:/indices/d/_sml.4903.html&member=@@ ^SML · http://www.marketclues.net/cgi-bin/myclues?chart=/:/futures/d/cr_a0.4903.html&member=@@ ^CRB · http://www.marketclues.net/cgi-bin/myclues?chart=/:/indices/d/_xau.4903.html&member=@@ ^XAU · http://www.marketclues.net/cgi-bin/myclues?chart=/:/indices/d/_btk.4903.html&member=@@ ^BTK · http://www.marketclues.net/cgi-bin/myclues?chart=/:/indices/d/_tyx.4903.html&member=@@ ^TYX
Sector Performance Since: 8 Apr 1999 · 18 Oct 1999 · A Week Ago · A Fortnight Ago
Sector Acceleration Since: 8 Apr 1999 · 18 Oct 1999 · A Week Ago · A Fortnight Ago

MyClues Home Page Link ("http://www.marketclues.net/cgi-bin/myclues?myhome=yes&member;[email protected]")

Stocks: Big Rally Needs a Correction

Note: more specific short term comments will be found on our
Trading Comments Page.

We had a very nice 7-day run starting on the morning of the 10th and it's time for a correction. Much of the rally was fueled by money coming out of the bond market as that market endured its first big correction of the year. But, bonds are showing signs of bottoming and rebounding now, so it's stocks turn to give some paper profits back.

Although there are signs that the correction might not begin until Monday or Tuesday, now is the time to hedge accounts if that's your inclination.

The Full Moon occurs on Monday morning and although this one isn't likely to correspond with a major top in the market, the one two months ago certainly did (22 Aug). We don't know why there's a relationship here, but it pays to be extra watchful around the dates of full and new moon. The word ``lunatic'' probably does apply to investors at times, as any experienced investor will likely agree.

Breadth has been trailing off during the course of this upswing and Friday's breadth was mediocre. This may be a fifth wave up from the bottom and it's a very weak one that looks to falter any time now.

Even though it was options expiration Friday, volume was relatively light as well, not a good sign for a continuing rally without a correction.

Option-based sentiment was in the moderate category Friday with OEX traders slightly bullish and NASDAQ traders slightly bearish. That's constructive for a continuing rally after a correction.

The market has moved into overbought territory after a solid week of gains. A similar overbought condition after the first leg up in the July rally led to a 58% retracement in the Dow (and more than 100% retracement in the NASDAQ-100). We don't think we're going to see a similar retracement here, but a 50% retracement is normal and healthy even in a bull market. To some extent, the strength this last week was due to option writers who were boosting share prices to avoid having to absorb big losses on their options. They bought stocks to raise the prices going into expiration Friday and are likely to dump those stocks Monday morning just as soon as they can.

If you're looking to sell the market short, you should probably wait for the first leg down and the rebound rally to do so. Remember, though, we're now in a seasonally strong time of year where surprises should ``inure to the benefit'' of the bulls. Always use stop loss orders on any positions you take. That way, the market will tell you when you're wrong (or, will tell you when to take your profits if you're right).

Commercial interests grew more bullish on the Dow Jones, increasing the number contracts long the Dow by 1364 contracts and decreasing the number of contracts short by 2193. Those commercials (who tend to be the ``smart money'') now hold 20,914 bullish positions to only 9630 bearish positions.

On the other hand, commercials grew slightly more bearish vis-a-vis the S&P 500 contract and now hold 429,448 contracts long to 449,138 contracts short, an increase of long contracts of 2378, but an increase of short contracts by 4003.

Whether this secular bear market will eventually take the Dow to 3500 (as we think it very well might) or not, your goal in investing is to make money, not to know the future. Listening to what the market is telling you is your best plan of action. Don't argue with the market: the market will win every time. Now, if we're just in another bear market rally destined to fail, you really shouldn't care: keep your stop loss orders in place trailing the rally (whether they are mental or actual). We're in a seasonal up time of year and if you take some profits off the table here, there will likely be a good time to buy the dip in the not-too-distant future.

Note: more specific short term comments will be found on our Trading Comments Page.

Euro Currency: http://www.marketclues.net/cgi-bin/myclues?chart=/:/futures/d/ec_a0.4903.html&member=wcorney@keatepartners.com

Still stuck in a trading range. But the commercials are growing even more bearish the Euro. As of Tuesday's close, they held 27,830 bullish positions, but 72,255 bearish ones. That's a decrease of 2773 bullish positions and an increase of 6920 bearish positions in just the last week.

U.S. Dollar Index: http://www.marketclues.net/cgi-bin/myclues?chart=/:/futures/d/dx_a0.4903.html&member=wcorney@keatepartners.com

It's an inverted picture of the Euro. Technically, we're still in a trading range that could break up or down. With the US economy appearing likely to rebound and the Euro economy sinking deeper, the US$ is still a better fundamental bet, although we think it has entered a secular bear market.

Canadian Dollar: http://www.marketclues.net/cgi-bin/myclues?chart=/:/futures/d/cd_a0.4903.html&member=wcorney@keatepartners.com

Commercials remain bearish: 20,142 bullish positions to 32,705 bearish positions. The chart trend agrees: down over the long term.

S&P Toronto Stock Exchange http://www.marketclues.net/cgi-bin/myclues?chart=/:/indices/d/_sptse.4903.html&member=wcorney@keatepartners.com

The Canadian market was slightly stronger than the Dow last week and broke above its resistance trendline drawn along the reaction highs of the year. In fact, it has almost reached the middle of the broad channel we have drawn in the chart. But, like the US, this market is overbought and needs a correction.

Australian Dollar: http://www.marketclues.net/cgi-bin/myclues?chart=/:/futures/d/ad_a0.4903.html&member=wcorney@keatepartners.com

The major bear market started in December 1996 with the A$ at 82US¢. A major leg down ended last year near 48US¢ and a vigorous rally carried the A$ to almost 58US¢ by the end of June. Since then, however, the A$ has fallen in five waves and rebounded in a what appears to be a corrective pattern. The low so far overlapped the top of the prior rally, so cannot be counted as a correction within an ongoing bull market, but as a bear market rally. Once the current countertrend bounce is over (should be no later than the end of January), the A$ should resume its downward trajectory.

The commercials agree. As of Tuesday's close, they held only 3211 contracts long and 21,450 short.

Now, that's good news. If you live in Australia, it helps boost export trade and helps you hang onto your job. It does make imported goods slightly more expensive, but job security may be more important than that. Also, it makes overseas investments that much better (earnings in US dollars would translate into more Australian dollars when repatriated). If you don't live in Australia, the falling A$ makes real estate and other Australian assets that much more attractive to buy for the long term.

Australian All Ordinaries: http://www.marketclues.net/cgi-bin/myclues?chart=/:/indices/d/_aord.4903.html&member=wcorney@keatepartners.com

The market held above its September 2001 low on this test. And, with a new long term support line in place, the trend is now up. Time Ratios project the next high in early July 2003. We count the long trading range of the last few years (since April 1999) as a wave 4 consolidation of the secular bull market (Australia is one of the last stock markets on this planet still in a long term bull market by our estimation). That, obviously, implies a 5th wave rally ahead. Targets for the Australian Index are 3815.52 and 4045.2. Of course, targets are just guesstimates. You should let the market tell you when it's finished going up. Still, those price levels should be good incentives to be aboard now. The market closed at 2967.4 Friday.
Australia Business News http://www.abc.net.au/news/business/default.htm
Yahoo! Australia Business News http://au.dailynews.yahoo.com/Full_Coverage/Australian_Economy/

London Financial-Times 100: http://www.marketclues.net/cgi-bin/myclues?chart=/:/indices/d/_ftse.4903.html&member=wcorney@keatepartners.com

The nice breakout of the polytrend resistance line was confirmed last week as the FTSE powered higher, heading for a test of the long term resistance shown in the weekly chart (the yellow polytrendline). Like the US, we have a short term overbought condition that will need a correction.

Bonds / Interest Rates:

Commercials covered some short positions in the long bond contract and ended Tuesday net long (317,643 contracts were held long to 316,517 short). They are even more bullish on the 10-Year Note: 764,917 were held long to 601,375 held short. That's an increase in bullish bets of 6456 contracts and a decrease in bearish positions of 1718 contracts. Note: more specific short term comments will be found on our Trading Comments Page.

Target 2030 Zero Coupon Bond Fund Quote

Sectors and Individual Stocks (Subscribers Only)

For tables ranking sectors and individual stocks, and links to charts of 3500 individual stocks and sectors, please visit your very own MyClues Home Page[http://www.marketclues.net/cgi-bin/myclues?myhome=yes&member=@@] -- in the CHARTS & RESEARCH section of the page, you will find a wealth of tools for selecting top sectors and stocks, including access to our exclusive realtime, intraday indicators.

For a 3-4 month free trial subscription, click here.

Commodities (Subscribers Only)

For complete charts of commodities, please visit your very own MyClues Home Page[http://www.marketclues.net/cgi-bin/myclues?myhome=yes&member=@@] -- in the CHARTS & RESEARCH section of the page, you will find links to webpages containing links to the following:

For a 3-4 month free trial subscription, click here.

CRB Index: http://www.marketclues.net/cgi-bin/myclues?chart=/:/futures/d/cr_a0.4903.html&member=wcorney@keatepartners.com

Commodity prices accelerated higher last week, but it's clear that a longer term period of consolidation is required in this bull market.

Copper: http://www.marketclues.net/cgi-bin/myclues?chart=/:/futures/d/hg_z2.4903.html&member=wcorney@keatepartners.com

The copper market dropped in five waves and has now rebounded in a wave A rally. Resistance lies in the area of the prior wave 4 high, around 71.40 basis the Dec contract. This market is highly dependent upon the new housing market, which is booming.

Format for printing. [Go back]

For Friday, October 18, 2002
© Bob Carver
$-Weighted OEX/QQQ Call/Put Ratios: 2.55/1.11
Popular Indices: http://www.marketclues.net/cgi-bin/myclues?chart=/:/indices/d/_spx.4903.html&member=@@ ^SPX · http://www.marketclues.net/cgi-bin/myclues?chart=/:/indices/d/_compq.4903.html&member=@@ ^IXQ · http://www.marketclues.net/cgi-bin/myclues?chart=/:/indices/d/_ndx.4903.html&member=@@ ^NDX · http://www.marketclues.net/cgi-bin/myclues?chart=/:/indices/d/_dj.4903.html&member=@@ ^DJI · http://www.marketclues.net/cgi-bin/myclues?chart=/:/indices/d/_mid.4903.html&member=@@ ^MID · http://www.marketclues.net/cgi-bin/myclues?chart=/:/indices/d/_oex.4903.html&member=@@ ^OEX · http://www.marketclues.net/cgi-bin/myclues?chart=/:/indices/d/_nya.4903.html&member=@@ ^NYA · http://www.marketclues.net/cgi-bin/myclues?chart=/:/indices/d/_vle.4903.html&member=@@ ^VLE · http://www.marketclues.net/cgi-bin/myclues?chart=/:/indices/d/_rut.4903.html&member=@@ ^RUT · http://www.marketclues.net/cgi-bin/myclues?chart=/:/indices/d/_sml.4903.html&member=@@ ^SML · http://www.marketclues.net/cgi-bin/myclues?chart=/:/futures/d/cr_a0.4903.html&member=@@ ^CRB · http://www.marketclues.net/cgi-bin/myclues?chart=/:/indices/d/_xau.4903.html&member=@@ ^XAU · http://www.marketclues.net/cgi-bin/myclues?chart=/:/indices/d/_btk.4903.html&member=@@ ^BTK · http://www.marketclues.net/cgi-bin/myclues?chart=/:/indices/d/_tyx.4903.html&member=@@ ^TYX
Sector Performance Since: 8 Apr 1999 · 18 Oct 1999 · A Week Ago · A Fortnight Ago
Sector Acceleration Since: 8 Apr 1999 · 18 Oct 1999 · A Week Ago · A Fortnight Ago

MyClues Home Page Link ("http://www.marketclues.net/cgi-bin/myclues?myhome=yes&member;[email protected]")

Martin Armstrong: Political Prisoner?
For those who are interested in what is happening in Martin Armstrong's case,
here is a link to the Martin Armstrong Defense Fund ("http://www.armstrongdefensefund.org/index.html").

Stocks: Doing An IBM Shuffle

On Wednesday, Intel dumped a bucket of cold water on the market and it gapped much lower on the opening. On Thursday, IBM set off a big gap-up opening by meeting revenue and earnings expectations. In fact, IBM's news sent almost all stocks higher. Once again, the bears who had tried to short sell the market rally lost (unless they were nimble, of course).

After the bell Thursday, Microsoft reported earnings and the initial reaction in the market was positive.

Art Cashin gave a good description of this market when he said that asset allocators, who divide their investments between bonds and stocks, have had a great year in bonds and a not so great year in stocks. Now, in a typical year, those allocators will shift their assets when they become unbalanced (they have target percentages for each market). However, because bonds had been doing so great and stocks so poorly, many of these allocators stuck with their bond investments. Until this week, that is.

This week the bond market really came unhinged and started giving back big hunks of profits. This stimulated those allocators to sell some of their bond assets and move back into stocks.

The other dynamic Art suggested at work is hedge funds, which have had a great year selling stocks short. They had been very successful simply selling every rally — until last week. As you may recall, the market dipped right down into support last week and found there were no more sellers below the July lows. With no more selling pressure and big paper profits, the hedge funds realized they had better buy to cover their short positions to lock in profits. That's why we saw the big rally last week (it was not, as many have suggested, a campaign by the Plunge Protection Team [PPT] to support the market).

Putting these two factors together, you have a market which is seeing a virtual flood of bond profits flowing into stocks. Add in one more factor: mutual funds. Every mutual fund manager knows that the October-December period is the strongest quarter of the year. Buying now is a win-win proposition for mutual fund managers. If the market goes up — as it does almost every October-December quarter — they're a hero at making money for investors and will attract more capital. If the market goes down, well, they simply were doing what they were paid to do: stay invested in stocks.

Thus, there's every reason for stocks to go up over the past week and almost no reason for stocks to go down.

After this big runup, however, and with Friday the day options expire for October, it's very likely we're going to see a pullback — a correction or retracement of some of the rally. However, with all the positives going for this market this time of year, any pullback should be a buying opportunity. Certainly, mutual fund managers who held out buying this week are going to want to buy the dip next week.

And, there's a more nebulous factor of the PPT buying to help the market stay afloat until after the early November elections. They may not need to come into the market. After all, it's doing fine so far on its own.

Short term, the OEX traders are too bullish and that's a warning of a top developing. Next week should see the market correct this runup, but it's very likely to be well within normal bull market parameters for a correction of 50-62% (retracement percentage of the rally). On the other hand, the NASDAQ traders are back to being wrongly bearish and are trying to call a top to the rally. On Wednesday, they were rabidly buying puts to try to profit from a retracement. On Thursday, though, they were even-handed, but that indicates they don't accept the reality of the rally yet. We are not convinced a good top for a 2-3 day correction will be in place until those traders are loaded to the gills with calls.

Format for printing. [Go back]

For Thursday, October 17, 2002
© Bob Carver
$-Weighted OEX/QQQ Call/Put Ratios: 1.26/0.24
Popular Indices: http://www.marketclues.net/cgi-bin/myclues?chart=/:/indices/d/_spx.4903.html&member=@@ ^SPX · http://www.marketclues.net/cgi-bin/myclues?chart=/:/indices/d/_compq.4903.html&member=@@ ^IXQ · http://www.marketclues.net/cgi-bin/myclues?chart=/:/indices/d/_ndx.4903.html&member=@@ ^NDX · http://www.marketclues.net/cgi-bin/myclues?chart=/:/indices/d/_dj.4903.html&member=@@ ^DJI · http://www.marketclues.net/cgi-bin/myclues?chart=/:/indices/d/_mid.4903.html&member=@@ ^MID · http://www.marketclues.net/cgi-bin/myclues?chart=/:/indices/d/_oex.4903.html&member=@@ ^OEX · http://www.marketclues.net/cgi-bin/myclues?chart=/:/indices/d/_nya.4903.html&member=@@ ^NYA · http://www.marketclues.net/cgi-bin/myclues?chart=/:/indices/d/_vle.4903.html&member=@@ ^VLE · http://www.marketclues.net/cgi-bin/myclues?chart=/:/indices/d/_rut.4903.html&member=@@ ^RUT · http://www.marketclues.net/cgi-bin/myclues?chart=/:/indices/d/_sml.4903.html&member=@@ ^SML · http://www.marketclues.net/cgi-bin/myclues?chart=/:/futures/d/cr_a0.4903.html&member=@@ ^CRB · http://www.marketclues.net/cgi-bin/myclues?chart=/:/indices/d/_xau.4903.html&member=@@ ^XAU · http://www.marketclues.net/cgi-bin/myclues?chart=/:/indices/d/_btk.4903.html&member=@@ ^BTK · http://www.marketclues.net/cgi-bin/myclues?chart=/:/indices/d/_tyx.4903.html&member=@@ ^TYX
Sector Performance Since: 8 Apr 1999 · 18 Oct 1999 · A Week Ago · A Fortnight Ago
Sector Acceleration Since: 8 Apr 1999 · 18 Oct 1999 · A Week Ago · A Fortnight Ago

MyClues Home Page Link ("http://www.marketclues.net/cgi-bin/myclues?myhome=yes&member;[email protected]")

Stocks: Intel's the Wet Blanket

Intel failed to deliver earnings in line with their guidance, sending the market tumbling early Wednesday. However, the sellers were notably weak in their attempts to push the market into that gap that formed on the opening Tuesday. And, after the close Wednesday, IBM reported better earnings and revenue than expected.

These news items inject a bit of noise into the market, but the trend remains the same: up. We're counting this dip as either a wave 2 correction in an ongoing bull market run or, alternately, a wave B correction in a bear market rally. In either case, we expect another leg up once the correction is finished, so the actual count is relatively unimportant at this stage. Once we get near the end of the next leg up, we'll be more concerned with the wave count. For now, though, we expect a pullback of up to 50-62% of the rally so far, then another thrust higher (perhaps into the next Bradley turn date.

Remember Martin Armstrong? He is the President of Princeton Economics and was jailed on government charges of defrauding investors. However, the government has never brought him to trial and has refused him bail. Some call it a government-led conspiracy to keep him under wraps. However, his Economic Confidence Model (shown above) has been a pretty reliable guide to some very significant turning points overall. According to it, this downturn should be over in this timeframe. Notice how the model had a major top in 1998. That turning point corresponded to the beginning of a long period of underperformance by most stocks, even though the big-name blue chips continued up into the 2000 turning point high. That 2002.85 turn date is about three weeks in the future (second week of November).

Sentiment is polarized: OEX traders are moderately bullish, but the NASDAQ QQQ options traders have turned extremely bearish, looking for a big pullback. Generally, that's a positive sign. However, those traders have actually been calling the next day's direction pretty well lately.

As for Thursday, we expect the market find some footing and rally since the bears had the ball Wednesday and failed to rack up any significant gains.

We're looking for further weakness in the bond market after the current wave 4 consolidation. That flow of funds from bonds into stocks should continue to frustrate stock market bears.

Format for printing. [Go back]

For Wednesday, October 16, 2002
© Bob Carver
$-Weighted OEX/QQQ Call/Put Ratios: 4.06/1.39
Popular Indices: http://www.marketclues.net/cgi-bin/myclues?chart=/:/indices/d/_spx.4903.html&member=@@ ^SPX · http://www.marketclues.net/cgi-bin/myclues?chart=/:/indices/d/_compq.4903.html&member=@@ ^IXQ · http://www.marketclues.net/cgi-bin/myclues?chart=/:/indices/d/_ndx.4903.html&member=@@ ^NDX · http://www.marketclues.net/cgi-bin/myclues?chart=/:/indices/d/_dj.4903.html&member=@@ ^DJI · http://www.marketclues.net/cgi-bin/myclues?chart=/:/indices/d/_mid.4903.html&member=@@ ^MID · http://www.marketclues.net/cgi-bin/myclues?chart=/:/indices/d/_oex.4903.html&member=@@ ^OEX · http://www.marketclues.net/cgi-bin/myclues?chart=/:/indices/d/_nya.4903.html&member=@@ ^NYA · http://www.marketclues.net/cgi-bin/myclues?chart=/:/indices/d/_vle.4903.html&member=@@ ^VLE · http://www.marketclues.net/cgi-bin/myclues?chart=/:/indices/d/_rut.4903.html&member=@@ ^RUT · http://www.marketclues.net/cgi-bin/myclues?chart=/:/indices/d/_sml.4903.html&member=@@ ^SML · http://www.marketclues.net/cgi-bin/myclues?chart=/:/futures/d/cr_a0.4903.html&member=@@ ^CRB · http://www.marketclues.net/cgi-bin/myclues?chart=/:/indices/d/_xau.4903.html&member=@@ ^XAU · http://www.marketclues.net/cgi-bin/myclues?chart=/:/indices/d/_btk.4903.html&member=@@ ^BTK · http://www.marketclues.net/cgi-bin/myclues?chart=/:/indices/d/_tyx.4903.html&member=@@ ^TYX
Sector Performance Since: 8 Apr 1999 · 18 Oct 1999 · A Week Ago · A Fortnight Ago
Sector Acceleration Since: 8 Apr 1999 · 18 Oct 1999 · A Week Ago · A Fortnight Ago

MyClues Home Page Link ("http://www.marketclues.net/cgi-bin/myclues?myhome=yes&member;[email protected]")

Stocks: Leaping Tall Buildings

The market leaped over prior resistance at the opening of trading Tuesday and never looked back. The market is doing exactly as expected: confounding the bears with its resilience and ability to form sideways consolidations and then break out to the upside.

What is fueling the rally is exactly what we've been calling for: a crashing bond market that had reached bubble status. And, as we all know, it takes a long, long time for bubbles to burst. The money that piled up in bonds is a huge reservoir of cash to fuel stock price rises.

CNBC (``Bubble-TV'') and Dow Jones would love for you to think the rally was due to better earnings reports — because they sell advertisements and want subscribers to think they have the insight you need. Nothing could be further from the truth, in fact. The rally is simple kindergarten supply-and-demand: the bulls have the supply of cash and the bears are running on empty. And, institutions who are heavy with cash are rushing buy orders into the market to avoid missing out on this upside explosion. Hedge funds are rushing to switch from short to long (that doubles their buying power, since they're not only buying to get long, they're buying to take profits on their short positions). And, small traders are rushing to sell the market short on the rally. Didn't their mothers tell them not to run in front of freight trains?

We have some targets for this rally as posted to our Trading Page, but we believe that as long as the tidal wave of money continues out of the bond market, there isn't much chance for stocks to correct very much. About the best the bears were able to get Tuesday was a sideways consolidation with an upward tilt to it. On a larger scale, this pattern reminded us of the late 1991 market, which preceded an explosive bull market move up the next year.

Technical indicators showed strong flows: the ratio of up-volume to down-volume on the NASDAQ was very close that 10 level that is a key figure for a bull market kickoff. And, there were about 3 advancing stocks on NASDAQ for every declining stock. The NYSE was trailing those strong figures, with a 7.02 ratio of up- to down-volume and breadth of 2.91. The lead dog is still leading: the NASDAQ-100 Index, which tipped off this rally by refusing to even retest prior lows on the dip last week and showing very bullish Money Flow divergence, performed in line with the rest of the market, which suggests that we're probably slightly more than halfway through this short term rally.

The gap higher Tuesday morning will, very likely, eventually need to be filled once the rally is complete. That gap is the place where we would expect the market to find support on a retracement. It also represents a key area for late buyers to come into the market. Thus, if you're looking to put on a long term bullish position, a test of the 8000 level on the Dow (right in the center of that gap) would be a great place to buy long in the futures.

You may recall that one of Joe Ross' students did something like that in the early 'Nineties. He ended up making a million dollars a year by simply maintaining that position over the years. Talk about long term position trading!

Format for printing. [Go back]

For Tuesday, October 15, 2002
© Bob Carver
$-Weighted OEX/QQQ Call/Put Ratios: 1.74/2.03
Popular Indices: http://www.marketclues.net/cgi-bin/myclues?chart=/:/indices/d/_spx.4903.html&member=@@ ^SPX · http://www.marketclues.net/cgi-bin/myclues?chart=/:/indices/d/_compq.4903.html&member=@@ ^IXQ · http://www.marketclues.net/cgi-bin/myclues?chart=/:/indices/d/_ndx.4903.html&member=@@ ^NDX · http://www.marketclues.net/cgi-bin/myclues?chart=/:/indices/d/_dj.4903.html&member=@@ ^DJI · http://www.marketclues.net/cgi-bin/myclues?chart=/:/indices/d/_mid.4903.html&member=@@ ^MID · http://www.marketclues.net/cgi-bin/myclues?chart=/:/indices/d/_oex.4903.html&member=@@ ^OEX · http://www.marketclues.net/cgi-bin/myclues?chart=/:/indices/d/_nya.4903.html&member=@@ ^NYA · http://www.marketclues.net/cgi-bin/myclues?chart=/:/indices/d/_vle.4903.html&member=@@ ^VLE · http://www.marketclues.net/cgi-bin/myclues?chart=/:/indices/d/_rut.4903.html&member=@@ ^RUT · http://www.marketclues.net/cgi-bin/myclues?chart=/:/indices/d/_sml.4903.html&member=@@ ^SML · http://www.marketclues.net/cgi-bin/myclues?chart=/:/futures/d/cr_a0.4903.html&member=@@ ^CRB · http://www.marketclues.net/cgi-bin/myclues?chart=/:/indices/d/_xau.4903.html&member=@@ ^XAU · http://www.marketclues.net/cgi-bin/myclues?chart=/:/indices/d/_btk.4903.html&member=@@ ^BTK · http://www.marketclues.net/cgi-bin/myclues?chart=/:/indices/d/_tyx.4903.html&member=@@ ^TYX
Sector Performance Since: 8 Apr 1999 · 18 Oct 1999 · A Week Ago · A Fortnight Ago
Sector Acceleration Since: 8 Apr 1999 · 18 Oct 1999 · A Week Ago · A Fortnight Ago

MyClues Home Page Link ("http://www.marketclues.net/cgi-bin/myclues?myhome=yes&member;[email protected]")

Stocks: Consolidation Monday

Trend Change Tuesday?

The stock market rally ran out of gas Monday as the flow of cash from the bond market was temporary shut down (the bond market had a holiday). Despite that, the market was able to close just slightly higher for the day. It will be a much greater feat to do so Tuesday, however.

With bond traders back from the long weekend, the stock market will sink or swim based upon the flow of funds from the bond pit. The first hour of trading in the bond market is likely to set the tone for stocks. Remember, bond trading starts at 8:20, an hour and ten minutes before stocks start trading. However, the Dow Jones futures pit starts trading at exactly the same time the bond pit starts, and there's a lot of interplay between the two pits (many traders will shift back and forth between the two, in fact). A weak bond market is a plus for stocks and vice versa.

The trendlines and Time Ratio projections suggest we could get a trading top in the second hour of trading Tuesday. We don't know just how large the retracement of the rally is likely to be, but we can't rule out a 100+% retracement just yet.

Sentiment has shifted now toward the bullish case, with the OEX pit finally beginning to embrace the trend. A retracement would help rebuild that ``Wall of Worry'' all bull rises must climb.

A reader asked for us to put the Bradley Calendar turn dates up, so we have obliged by publishing a Special Report called Bradley Turning Points. The table lists turning points from the traditional Bradley calendar through September 2003.

This week brings options expiration on Friday, so we are likely to see the fight between the bulls and bears heat up toward the end of the week. Right now, despite the nice rally last week, Maximum Pain Theory suggests the OEX would need to rise about 9% to create the maximum loss for OEX option participants. This suggests we could have a positive bias to the week overall. However, we are taking this market one day at a time.

Format for printing. [Go back]

For Monday, October 14, 2002
© Bob Carver
$-Weighted OEX/QQQ Call/Put Ratios: 0.36/2.69
Popular Indices: http://www.marketclues.net/cgi-bin/myclues?chart=/:/indices/d/_spx.4903.html&member=@@ ^SPX · http://www.marketclues.net/cgi-bin/myclues?chart=/:/indices/d/_compq.4903.html&member=@@ ^IXQ · http://www.marketclues.net/cgi-bin/myclues?chart=/:/indices/d/_ndx.4903.html&member=@@ ^NDX · http://www.marketclues.net/cgi-bin/myclues?chart=/:/indices/d/_dj.4903.html&member=@@ ^DJI · http://www.marketclues.net/cgi-bin/myclues?chart=/:/indices/d/_mid.4903.html&member=@@ ^MID · http://www.marketclues.net/cgi-bin/myclues?chart=/:/indices/d/_oex.4903.html&member=@@ ^OEX · http://www.marketclues.net/cgi-bin/myclues?chart=/:/indices/d/_nya.4903.html&member=@@ ^NYA · http://www.marketclues.net/cgi-bin/myclues?chart=/:/indices/d/_vle.4903.html&member=@@ ^VLE · http://www.marketclues.net/cgi-bin/myclues?chart=/:/indices/d/_rut.4903.html&member=@@ ^RUT · http://www.marketclues.net/cgi-bin/myclues?chart=/:/indices/d/_sml.4903.html&member=@@ ^SML · http://www.marketclues.net/cgi-bin/myclues?chart=/:/futures/d/cr_a0.4903.html&member=@@ ^CRB · http://www.marketclues.net/cgi-bin/myclues?chart=/:/indices/d/_xau.4903.html&member=@@ ^XAU · http://www.marketclues.net/cgi-bin/myclues?chart=/:/indices/d/_btk.4903.html&member=@@ ^BTK · http://www.marketclues.net/cgi-bin/myclues?chart=/:/indices/d/_tyx.4903.html&member=@@ ^TYX
Sector Performance Since: 8 Apr 1999 · 18 Oct 1999 · A Week Ago · A Fortnight Ago
Sector Acceleration Since: 8 Apr 1999 · 18 Oct 1999 · A Week Ago · A Fortnight Ago

MyClues Home Page Link ("http://www.marketclues.net/cgi-bin/myclues?myhome=yes&member;[email protected]")

Stocks: It's a Bull Market Again

The stock market confirmed Thursday morning's low as the bottom of the bear market by rallying sharply higher Friday. At one point in the session, advancing issues led decliners by a 4:1 ratio. Moreover, volume was heavy in the gainers, with about 18 times as much volume going into advancers at the high of the day. Toward the close, the inevitable profit-taking trimmed the sails ahead of the holiday weekend. Even so, the market put in good percentage gains in all indices. The advance-decline ratio ended at 3.55 and the volume ratio ended at 8.52, close to the magical ratio of 10 which will confirm the bull market.

Now, we aren't out of the secular (long term) woods by a long shot yet. However, we have very likely ended the first leg down in the secular bear market and have embarked upon the second leg, a bull market rally. Most investors would call this a bull market because it should result in a 20% or higher gain in the indices (should be considerably more than 20% in fact), so we'll go along with that appellation.

After bottoming in July at a Fibonacci support level (a 50% retracement of the entire bull market run from the 1932 Depression low to the March 2000 high), the market rallied in August, then fell again to retest that key support level. On Thursday that level was retested and held (the slight dip below it saw no increased selling pressure, so the bears were forced to admit that the bear market was over and to take profits by buying back contracts they had sold short). This beach ball of a market, which had been held underwater for several months by the bears, was finally released and we had a big two-day rally that should stretch into next week before pulling back to potentially retest the lows as early as late next week.

Counting the Elliott Waves, you can see from the Dow daily chart below

that we have completed a five-wave down movement from highs made earlier this year. Five complete waves down signals a trend change to the upside in Elliott Wave Theory, so we should expect an up trend from here. Since the bear market started in March 2000 in the S&P 500 and NASDAQ, we're counting that entire move down as wave A within the larger degree bear market which is correcting the excesses built up in the rise since July 1932. In fact, it was no surprise that wave A was the worst bear market since the 'Thirties as reported by several news sources last week. That makes sense from several technical perspectives, since we expect the bear market will retrace — eventually — to the area of the previous fourth wave (which occured in 1994). Of course, it won't be required to do it solely in the first leg down — it will take a zigzag course to do so, with wave C (down) likely to retest current levels and to break to a slightly lower low. But, we've had our first wave down, now we need a break from singing the bear blues and need to mount a nice wave B rally which retraces at least half of the decline (which would carry the NASDAQ-100 Index to 2805 from the sub-basement it finds itself in right now). After the retracement wave B, though, we're going to see wave C down. Wave C tends to be stronger on the downside than wave A, so we have a lot of roller-coaster ride to look forward to.

Sentiment remained on the extremely bearish side in the OEX Friday, which is very constructive. However, the NASDAQ traders are still favoring calls, so a further washout may be necessary in the market to force these traders to give up.

The next significant short term rally top should occur on Tuesday or Wednesday, but we'll take this one day at a time. With the kind of strong momentum this market has going for it, it may be pushed out later. The next Time Ratio Low of significance comes on the 18th, but since that's options expiration, it could turn into a high. In any case, if we've seen the beginning of a bull market, the retracement should be held to 50% or 62% of the points covered in the current rally.

One indicator which called this market turn to a `T' was the Bradley Calendar. This is a technical tool which some traders use to pinpoint turns in the market (it doesn't predict highs or lows, just trend changes — similar to our Time Ratio projections). According to that calendar, a significant turn should have occured on the 9th (Wednesday, a potential low turning point) — we got that turn in the first hour of trading Thursday morning. The next turn according to the calendar should occur on October 28th, nominally a high. After that, the 8th of November is a nominal short term low and the 25th of November a very significant nominal high. If the high of the year occurs in late November at the Bradley date, look for a crash into March (the next Bradley turn date is March 13th). Interestingly, our own Omega Predictor's long term outlook is calling for the same thing. And, our long term polytrendline analysis of the S&P 500 Index shows March 2003 as a very significant long term low. This is an amazing (and very likely very significant) confluence of indicators.

Commercial interests remain bullish the Dow with 19,550 futures contracts held long to only 11,823 held short. Usually, the commercials are the ``smart money''. We are seeing some signs the economy is turning up from the depths of this depression, but they are tentative. Still, the market is sniffing out some kind of recovery here and we won't argue with it for now. We do have our doubts about the economy down the road, as the following section indicates.

The Current Economic Depression: Who's To Blame?

Answer: Computers
People always want to find a scapegoat for their problems. They made a bad investment and somebody must be punished. It's that old Puritan ethic, perhaps. But, it's really just basic human nature. So, the current climate of blaming corporate management for all stock market ills just doesn't cut the mustard because it lays the blame on a small percentage of insiders who couldn't have created the general dowturn in the economy. Back in the 1930's, politicians were quick to point the finger at the bears, whose short selling was blamed for the Great Depression.

In reality, the whole society is responsible for the current economic depression. Yes, Virginia, it's a depression, not a recession and it's going to last a long time and get a lot worse before things get much better. But, if you want to blame anything, blame computers. The advent of computers has meant huge productivity gains in business, allowing them to increase production well beyond the growth rate of sales and income. We now have a glut of production capacity as well as human labor, which is why this economy has not recovered despite a dozen rate cuts from the Greenspan Fed. Labor costs are being cut by laying off employees, but computers are not being laid off. The economy, in fact, will not recover from this mismatch of production to demand for a long, long time — despite the advent of a big bear market rally which we've embarked upon. As layoffs continue and escalate, businesses will be selling to a smaller pie.

It used to be said that the consumer is two-thirds of the economy. News flash: the consumer is now 100% of the economy and that consumer is pulling back. Business has stopped making investments in the future: it sees no need to expand production. There's too much production for the demand.

How can the ``authorities'' stimulate the economy? First of all, it would take all of the control levers at the disposal of the Federal Reserve, Congress and the Bushy Administration to even slightly ameliorate the current decline. The old methods of stimulus just don't work anymore because of the productivity gains, which are almost entirely due to the use of computers.

Secondly, none of those institutions have the insight or intelligence to attempt to start fixing the economy. Given no skill on the part of government, it will take many years for the situation to work itself out — and will be very painful, even fatal (in the case of war casualties) for some — see Terry Laundry's current update for a discussion of what happens during down phases similar to the current one. It's something we've warned about many times before.

Attention, Luddites!
Faster solutions to the oversupply problem exist, but are not legal. However, it is possible that one of those solutions will come about through electronic warfare. We won't say exactly how such a thing could occur, but the solution is illegal because it involves destruction of property used in the production of goods and services. If the problem is a glut, the glut has to be destroyed in some way, either through time (obsolescence) or physical destruction. And, the computers businesses use are very vulnerable to attack by electronic means.

Euro Currency: http://www.marketclues.net/cgi-bin/myclues?chart=/:/futures/d/ec_a0.4903.html&member=wcorney@keatepartners.com

No real change in the Euro last week as it treads water. The European economy is sinking, which explains the weakness in their currency. Commercial traders remain very bearish toward the Euro, with only 30,603 contracts held long to 65,335 held short as of Tuesday's close. Commercials are generally considered the ``smart money,'' while small traders are ``dumb money.''

U.S. Dollar Index: http://www.marketclues.net/cgi-bin/myclues?chart=/:/futures/d/dx_a0.4903.html&member=wcorney@keatepartners.com

The Dollar Index, despite some intraweek weakness (a minor degree diagonal triangle collapsed in the middle of the trading range), recovered some of its losses on the strength in the stock market. Commercial interests, which have been long the Dollar Index, remain so: 4,541 long to 3,583 short, which is a decrease of long interest by 380 and an increase in short interest of 1406, indicating that the days of a strong dollar may be drawing to a close. We still rate the long term picture in the US Dollar Index a bear market. However, the future falling dollar will do much good to revive the US economy in a world virtually devoid of hard money. Competitive devaluation will provide a crutch for the economy.

Canadian Dollar: http://www.marketclues.net/cgi-bin/myclues?chart=/:/futures/d/cd_a0.4903.html&member=wcorney@keatepartners.com

The sideways lack of trend continues, with commercial interests remaining heavily short the CD (19,501 long to 32,263 short).

S&P Toronto Stock Exchange http://www.marketclues.net/cgi-bin/myclues?chart=/:/indices/d/_sptse.4903.html&member=wcorney@keatepartners.com

The bottom in the Canadian market appears to have coincided with the bottom in the US market as bullish divergence on the oscillator and a rounding bottom appear to have been signalled by the successful test of the summer low.

Australian Dollar: http://www.marketclues.net/cgi-bin/myclues?chart=/:/futures/d/ad_a0.4903.html&member=wcorney@keatepartners.com

Commercials added heavily to their short position last week, tipping the coming fall in the Australian Dollar. By Tuesday's close, they held only 3,208 contracts long to 21,684 short. That was a decrease in longs of 635 contracts and an increase in shorts of 6368. Small traders (i.e., "dumb money") are heavily long the currency (15,583 long to 2,952 short). There could be a precipitous fall in store for the A$.

Australian All Ordinaries: http://www.marketclues.net/cgi-bin/myclues?chart=/:/indices/d/_aord.4903.html&member=wcorney@keatepartners.com

The weekly chart indicates we have had a successful retest of the support line drawn using the lows of October 1999 and September 2001. The pattern appears to be an expanding triangle. If that's correct, it completes a wave 4 of a five-wave up sequence and we should see a fifth wave rally from here. Our preliminary target is for that bull market rally to carry to the overhead red resistance line. A Time Ratio High can be calculated for July 4th, 2003. If the high occurs then, the red resistance line will be near 4220, well over 1400 points above Friday's closing value. A falling A$ is good for Australia's export economy. US investors are going to get another opportunity to buy Australian real estate cheaper after the fall. If you're outside Australia and buying Australian stocks, a reasonable strategy could involve selling the Australian Dollar short in proportion to your stock market investment. This would provide a hedge against a falling A$. This is a sophisticated strategy, but would provide some protection against a precipitous drop in the dollar.
Australia Business News http://www.abc.net.au/news/business/default.htm
Yahoo! Australia Business News http://au.dailynews.yahoo.com/Full_Coverage/Australian_Economy/

London Financial-Times 100: http://www.marketclues.net/cgi-bin/myclues?chart=/:/indices/d/_ftse.4903.html&member=wcorney@keatepartners.com

The FTSE has confirmed its low with Friday's rally above the falling resistance line shown in the daily chart (link above) and should now be on its way to retest the price range it spent so long within earlier in the year: 5000-5400. The index closed Friday at 3953.40 up 4.66%. We're looking for at least a 1000-point rally (20%) ahead.

Bonds / Interest Rates: The Dam Has Broken

The bond market is going to look like the old stock graveyard to investors — and soon. On Friday, the big rally on Wall Street convinced some bond players to sell bonds and buy equities, creating the confirmation we have been looking for to call a top in place in the bond market. Now, we could have additional weakness in stocks and strength in bonds, but rallies in bonds are opportunities to sell that market short.

Money should come flooding out of bonds, looking for a new home. It's very likely that some of that money will end up in the stock market.

On Friday, the Target 2030 fund fell almost 3%. Now you know what we meant with that comment about bonds falling as fast as dotcoms.

Target 2030 Zero Coupon Bond Fund Quote

Sectors and Individual Stocks (Subscribers Only)

For tables ranking sectors and individual stocks, and links to charts of 3500 individual stocks and sectors, please visit your very own MyClues Home Page[http://www.marketclues.net/cgi-bin/myclues?myhome=yes&member=@@] -- in the CHARTS & RESEARCH section of the page, you will find a wealth of tools for selecting top sectors and stocks, including access to our exclusive realtime, intraday indicators.

For a 3-4 month free trial subscription, click here.

Commodities (Subscribers Only)

For complete charts of commodities, please visit your very own MyClues Home Page[http://www.marketclues.net/cgi-bin/myclues?myhome=yes&member=@@] -- in the CHARTS & RESEARCH section of the page, you will find links to webpages containing links to the following:

For a 3-4 month free trial subscription, click here.

CRB Index: http://www.marketclues.net/cgi-bin/myclues?chart=/:/futures/d/cr_a0.4903.html&member=wcorney@keatepartners.com

The CRB Index is closing in on that long term support polytrendline (yellow) on the daily and weekly charts. Each time the index has touched that line in the past, it has accelerated higher off it. That's exactly what we expect this time. Rising commodity prices will blunt the force of deflation on the economy.

Copper: http://www.marketclues.net/cgi-bin/myclues?chart=/:/futures/d/hg_v2.4903.html&member=wcorney@keatepartners.com

Copper has bottomed and turned up, signalling the recession is lifting. This is a very positive sign for the economy and the stock market. Rising inflation means some pricing power will enter the economy to offset the downward pressure of deflation.

Format for printing. [Go back]

For Friday, October 11, 2002
© Bob Carver
$-Weighted OEX/QQQ Call/Put Ratios: 0.57/2.00
Popular Indices: http://www.marketclues.net/cgi-bin/myclues?chart=/:/indices/d/_spx.4903.html&member=@@ ^SPX · http://www.marketclues.net/cgi-bin/myclues?chart=/:/indices/d/_compq.4903.html&member=@@ ^IXQ · http://www.marketclues.net/cgi-bin/myclues?chart=/:/indices/d/_ndx.4903.html&member=@@ ^NDX · http://www.marketclues.net/cgi-bin/myclues?chart=/:/indices/d/_dj.4903.html&member=@@ ^DJI · http://www.marketclues.net/cgi-bin/myclues?chart=/:/indices/d/_mid.4903.html&member=@@ ^MID · http://www.marketclues.net/cgi-bin/myclues?chart=/:/indices/d/_oex.4903.html&member=@@ ^OEX · http://www.marketclues.net/cgi-bin/myclues?chart=/:/indices/d/_nya.4903.html&member=@@ ^NYA · http://www.marketclues.net/cgi-bin/myclues?chart=/:/indices/d/_vle.4903.html&member=@@ ^VLE · http://www.marketclues.net/cgi-bin/myclues?chart=/:/indices/d/_rut.4903.html&member=@@ ^RUT · http://www.marketclues.net/cgi-bin/myclues?chart=/:/indices/d/_sml.4903.html&member=@@ ^SML · http://www.marketclues.net/cgi-bin/myclues?chart=/:/futures/d/cr_a0.4903.html&member=@@ ^CRB · http://www.marketclues.net/cgi-bin/myclues?chart=/:/indices/d/_xau.4903.html&member=@@ ^XAU · http://www.marketclues.net/cgi-bin/myclues?chart=/:/indices/d/_btk.4903.html&member=@@ ^BTK · http://www.marketclues.net/cgi-bin/myclues?chart=/:/indices/d/_tyx.4903.html&member=@@ ^TYX
Sector Performance Since: 8 Apr 1999 · 18 Oct 1999 · A Week Ago · A Fortnight Ago
Sector Acceleration Since: 8 Apr 1999 · 18 Oct 1999 · A Week Ago · A Fortnight Ago

MyClues Home Page Link ("http://www.marketclues.net/cgi-bin/myclues?myhome=yes&member;[email protected]")

Stocks: Another Pop Fly Rally?

The market dipped below the July low in the S&P 500 Index as that index joined most of the others in the basement. However, contrary to most traders' expectations, there were no sell stop orders of substance waiting at that level. With the market unable to satisfy the bears by plummeting lower, those bears became the latest victims by having to take profits on their short positions by becoming temporary buyers.

The market rallied nicely Thursday as we expected it would. However, we needed to see additional money flowing into the market after the rally pushed back close to resistance — and we didn't. Although it is still possible we will see that money come back into the market on the next dip, we have a potential for another plunge to and below the recent lows on Friday. That's especially true when you consider that short term traders who bought the market on weakness Tuesday and Wednesday are likely to be cashing in their chips before the weekend — as they have before almost every weekend for the past few months. Thus, this market continues to confound investors as it gropes for a bottom.

Sentiment remained constructive on the OEX gauge Thursday as almost twice as much money went into put options (downside protection) compared to calls (upside bets). That's helpful, but the first day of a rally typically sees this kind of ratio because traders who turn bullish tend to sell their puts, leading to volume on the put side despite their turn to the bullish case. In the present market, though, we suspect there weren't that many traders turning bullish just yet. That's because every recent rally has simply been a trading opportunity to play the long (bullish) side, then sell it as it ran it out of gas.

NASDAQ players remain far too bullish for comfort that the NDX bottom is in place yet. The indicator pointed toward twice as much money going into upside bets, which (as a contrary indicator) is not a positive for bulls.

Indeed, this rally appears to be running out of gas as it stalled in mid-afternoon below resistance. There are Time Ratio Highs (very short term ones, though) due early in the day on Friday. However, all hope for the bulls is not lost: the bond market is a huge reservoir of cash that will eventually bail out the stock market. When bond traders see a confirmed bottom in stocks, they will be selling bonds and putting some of that cash to work in the stock market. That's why we're watching the bond market closely for signs of a confirmed top — when that comes, we will definitely want to aggressively buy dips because the trend will have turned.

Format for printing. [Go back]

For Thursday, October 10, 2002
© Bob Carver
$-Weighted OEX/QQQ Call/Put Ratios: 0.49/0.99
Popular Indices: http://www.marketclues.net/cgi-bin/myclues?chart=/:/indices/d/_spx.4903.html&member=@@ ^SPX · http://www.marketclues.net/cgi-bin/myclues?chart=/:/indices/d/_compq.4903.html&member=@@ ^IXQ · http://www.marketclues.net/cgi-bin/myclues?chart=/:/indices/d/_ndx.4903.html&member=@@ ^NDX · http://www.marketclues.net/cgi-bin/myclues?chart=/:/indices/d/_dj.4903.html&member=@@ ^DJI · http://www.marketclues.net/cgi-bin/myclues?chart=/:/indices/d/_mid.4903.html&member=@@ ^MID · http://www.marketclues.net/cgi-bin/myclues?chart=/:/indices/d/_oex.4903.html&member=@@ ^OEX · http://www.marketclues.net/cgi-bin/myclues?chart=/:/indices/d/_nya.4903.html&member=@@ ^NYA · http://www.marketclues.net/cgi-bin/myclues?chart=/:/indices/d/_vle.4903.html&member=@@ ^VLE · http://www.marketclues.net/cgi-bin/myclues?chart=/:/indices/d/_rut.4903.html&member=@@ ^RUT · http://www.marketclues.net/cgi-bin/myclues?chart=/:/indices/d/_sml.4903.html&member=@@ ^SML · http://www.marketclues.net/cgi-bin/myclues?chart=/:/futures/d/cr_a0.4903.html&member=@@ ^CRB · http://www.marketclues.net/cgi-bin/myclues?chart=/:/indices/d/_xau.4903.html&member=@@ ^XAU · http://www.marketclues.net/cgi-bin/myclues?chart=/:/indices/d/_btk.4903.html&member=@@ ^BTK · http://www.marketclues.net/cgi-bin/myclues?chart=/:/indices/d/_tyx.4903.html&member=@@ ^TYX
Sector Performance Since: 8 Apr 1999 · 18 Oct 1999 · A Week Ago · A Fortnight Ago
Sector Acceleration Since: 8 Apr 1999 · 18 Oct 1999 · A Week Ago · A Fortnight Ago

MyClues Home Page Link ("http://www.marketclues.net/cgi-bin/myclues?myhome=yes&member;[email protected]")

Stocks: Seasonal Influences

September is the month when seasonal influences really start to dominate the stock market. But, October is probably the best time to be a buyer of stocks. That's because mutual funds close out their tax years at the end of October, allowing them to offset capital gains with capital losses and not burden their shareholders with the double whammy of a net asset value that's underwater at the same time they generate taxable gains and pass them on as an unwanted Christmas present to shareholders.

An interesting question arises here. In most years, when most mutual funds generate gains, it's generally wise for investors to avoid buying those funds late in the year. That's because they have capital gains to distribute. Why have to pay taxes on transactions which occured before you bought shares? But, this year, given the capital losses some funds are undoubtedly generating, mightn't there be a tax advantage to buying some funds just to capture their tax losses? It's an interesting question — and could turn out to be an easy way to save on taxes — and we don't have a definitive answer at the present time, but we're open to suggestions (IANAL).

We're now right in the middle of this silly season of selling just to take tax losses. That may be the primary reason why we're seeing the breadth figures so poor, in fact. Still, even with the very poor breadth of recent sessions, we're beginning to see more volume into rising stocks than in declining stocks. And, that is confirmed by Money Flow, which is diverging bullishly (rising while prices decline) on the NASDAQ, SPX, Value Line and NYSE Composite (our computation of the Money Flow line is shown on the quarter-hourly charts updated intraday and on a couple of daily charts — SPX and VLE).

And, our lead-dog index, NASDAQ-100 (NDX), is refusing to make lower lows here. That's a strongly bullish sign that we're in the vicinity of a long term bottom. We love to see our lead-dog taking the lead again. Perhaps the high-tech stocks will get an extra boost this year from tax loss repurchases (might be a good place to look for mutual funds taking losses in stocks they own and plan to repurchase after 30 days).

Sentiment is falling into place finally: the OEX sentiment figure closed just at the overly-bearish level on Wednesday. In other words, it wasn't as overly-bearish as in prior days despite lower prices. That's called bullish divergence and it's a reason to be a buyer of stocks, not a seller. Even the NASDAQ traders pulled in their horns a bit, putting just about as much money into downside protection as into upside speculation.

If we do get a bottom here (a Time Ratio Low is due in the first hour of trading Thursday), we should get a good short term rally and a retest on October 28th. The retest should come at a higher level, but it's anyone's guess. We have a resistance polytrendline in the bond market that tops out on the 28th and gains in bonds have been negatively correlated to stocks recently. The 28th is also a significant date on the Bradley Calendars. Those are good arguments that we should see an end of month dip for investors to add to stock holdings (and, perhaps, sell bonds short!).

Interesting coincidence: Single stock futures will begin trading at the end of October through the first part of November. Look for an enhanced ability for manipulation of stock prices to take place as insiders find it relatively easier to push their stock prices up (20% margin in stock futures versus 50% in the cash market). Nobody talks about the ``M'' word on Wall Street, but there's little doubt most stock prices are manipulated for the benefit of insiders.

We see strong flows coming into stocks in the last part of the year from:

We also are likely to see a stronger market into next week as put option writers whose instruments are underwater force prices higher — similar to the May rally.

Format for printing. [Go back]

For Wednesday, October 9, 2002
© Bob Carver
$-Weighted OEX/QQQ Call/Put Ratios: 0.23/3.08
Popular Indices: http://www.marketclues.net/cgi-bin/myclues?chart=/:/indices/d/_spx.4903.html&member=@@ ^SPX · http://www.marketclues.net/cgi-bin/myclues?chart=/:/indices/d/_compq.4903.html&member=@@ ^IXQ · http://www.marketclues.net/cgi-bin/myclues?chart=/:/indices/d/_ndx.4903.html&member=@@ ^NDX · http://www.marketclues.net/cgi-bin/myclues?chart=/:/indices/d/_dj.4903.html&member=@@ ^DJI · http://www.marketclues.net/cgi-bin/myclues?chart=/:/indices/d/_mid.4903.html&member=@@ ^MID · http://www.marketclues.net/cgi-bin/myclues?chart=/:/indices/d/_oex.4903.html&member=@@ ^OEX · http://www.marketclues.net/cgi-bin/myclues?chart=/:/indices/d/_nya.4903.html&member=@@ ^NYA · http://www.marketclues.net/cgi-bin/myclues?chart=/:/indices/d/_vle.4903.html&member=@@ ^VLE · http://www.marketclues.net/cgi-bin/myclues?chart=/:/indices/d/_rut.4903.html&member=@@ ^RUT · http://www.marketclues.net/cgi-bin/myclues?chart=/:/indices/d/_sml.4903.html&member=@@ ^SML · http://www.marketclues.net/cgi-bin/myclues?chart=/:/futures/d/cr_a0.4903.html&member=@@ ^CRB · http://www.marketclues.net/cgi-bin/myclues?chart=/:/indices/d/_xau.4903.html&member=@@ ^XAU · http://www.marketclues.net/cgi-bin/myclues?chart=/:/indices/d/_btk.4903.html&member=@@ ^BTK · http://www.marketclues.net/cgi-bin/myclues?chart=/:/indices/d/_tyx.4903.html&member=@@ ^TYX
Sector Performance Since: 8 Apr 1999 · 18 Oct 1999 · A Week Ago · A Fortnight Ago
Sector Acceleration Since: 8 Apr 1999 · 18 Oct 1999 · A Week Ago · A Fortnight Ago

MyClues Home Page Link ("http://www.marketclues.net/cgi-bin/myclues?myhome=yes&member;[email protected]")

Stocks: Very Near a Low

Stocks rallied back Tuesday as expected, but breadth (the number of advancing issues compared to the number of declining issues) was poor, so the market doesn't seem to have finished putting in a bottom. Our Trading Page displays breadth statistics all day long and it showed more declining issues than advancing ones. It also showed that although the ratio of up volume to down volume was positive — greater than 1.0 — for the NYSE, it remained negative — below 1.0 — for the NASDAQ. Confirmation of a bull market in effect will have to wait until we can see the ratio of up volume to down volume exceed 10.

The rally was very likely a wave 4 within a five-wave decline known as a diagonal triangle. That means there should be one more wave down to finish off this bear market. The wave 5 down probably got started before the market closed Tuesday afternoon, in fact. There is a cluster of trendlines in the S&P 500 (SPX) Index which are going to intersect on Wednesday and Thursday — and they could provide a good bottoming zone for this market. In addition, there are rounding polytrendlines which also bottom in that same timeframe in the NASDAQ-100 Index (NDX) and in the Semiconductor Index (SOX). SOX, in fact, is probably the real leading indicator at the present time. When the SOX starts turning up, it should signal the high-tech industry has finally bottomed and is recovering. We believe the NASDAQ will need to lead the way higher in the next bull market, so we're awaiting signs of that happening. There is a Time Ratio Low due for SOX very early Friday morning, as well as a measured move target near 200. That index has fallen from the price area above 360 in late August to near that 200 target.

Sentiment was, once again, painting a very mixed picture. The OEX pits had a healthy amount of put buying (mostly hedging activity by institutional and other portfolio holders, but it still counts as bearish bets) compared to call buying. But, the NASDAQ QQQ traders are still obnoxiously bullish and are indicating there is room on the downside in the high-tech sectors still after massive declines. That they are still trying to call the bottom is a strong sign that the next bull market may be somewhat limited in its overall scope (still very much worth being invested in, of course).

Bonds / Interest Rates: Bottoming Formation

Interest rates are forming a rounding bottom as shown on the Ten Year Note Quarter-Hourly Chart as a red polytrendline under recent lows. As long as this trendline remains unbroken, it's very good news for stock investors — and very bearish news for bond investors who now have the potential for large capital losses in their bond portfolios.

Target 2030 Zero Coupon Bond Fund Quote

Format for printing. [Go back]

For Tuesday, October 8, 2002
© Bob Carver
$-Weighted OEX/QQQ Call/Put Ratios: 0.24/1.47
Popular Indices: http://www.marketclues.net/cgi-bin/myclues?chart=/:/indices/d/_spx.4903.html&member=@@ ^SPX · http://www.marketclues.net/cgi-bin/myclues?chart=/:/indices/d/_compq.4903.html&member=@@ ^IXQ · http://www.marketclues.net/cgi-bin/myclues?chart=/:/indices/d/_ndx.4903.html&member=@@ ^NDX · http://www.marketclues.net/cgi-bin/myclues?chart=/:/indices/d/_dj.4903.html&member=@@ ^DJI · http://www.marketclues.net/cgi-bin/myclues?chart=/:/indices/d/_mid.4903.html&member=@@ ^MID · http://www.marketclues.net/cgi-bin/myclues?chart=/:/indices/d/_oex.4903.html&member=@@ ^OEX · http://www.marketclues.net/cgi-bin/myclues?chart=/:/indices/d/_nya.4903.html&member=@@ ^NYA · http://www.marketclues.net/cgi-bin/myclues?chart=/:/indices/d/_vle.4903.html&member=@@ ^VLE · http://www.marketclues.net/cgi-bin/myclues?chart=/:/indices/d/_rut.4903.html&member=@@ ^RUT · http://www.marketclues.net/cgi-bin/myclues?chart=/:/indices/d/_sml.4903.html&member=@@ ^SML · http://www.marketclues.net/cgi-bin/myclues?chart=/:/futures/d/cr_a0.4903.html&member=@@ ^CRB · http://www.marketclues.net/cgi-bin/myclues?chart=/:/indices/d/_xau.4903.html&member=@@ ^XAU · http://www.marketclues.net/cgi-bin/myclues?chart=/:/indices/d/_btk.4903.html&member=@@ ^BTK · http://www.marketclues.net/cgi-bin/myclues?chart=/:/indices/d/_tyx.4903.html&member=@@ ^TYX
Sector Performance Since: 8 Apr 1999 · 18 Oct 1999 · A Week Ago · A Fortnight Ago
Sector Acceleration Since: 8 Apr 1999 · 18 Oct 1999 · A Week Ago · A Fortnight Ago

MyClues Home Page Link ("http://www.marketclues.net/cgi-bin/myclues?myhome=yes&member;[email protected]")

Stocks: Signs of a Bear Market Bottom

Comparing how the broad market is performing relative to the blue chips has always been valuable. Back in early 2000, the Value Line Arithmetic Index of approximately 1600 equally-weighted stocks had been underperforming the S&P 500 Index of 500 capitalization-weighted blue chip stocks for many years (six, to be exact). A sea change occured right at the very top, however, and the Value Line continued higher for the next two years while the blue chips got cut almost in half.

Referring to the Weekly Chart of the Value Line/S&P 500 Ratio you can clearly see that from early 2000 until just recently, the ratio of the Value Line to S&P 500 channeled higher. This was the period which saw the NASDAQ humbled to 20% of its peak value while the broad market powered to a succession of all-time record highs. But, since the July low in the market indices, the ratio has broken down below that uptrend channel, signaling yet another sea change as the bear market draws to an end. This tells us that the next bull market is warming up and will be led by the blue chips and not the broad market. A weaker US Dollar, although not a panacea for all economic ills (a system of fiat money will eventually lead to bankruptcy, although the game can go on longer than any gold bug's patience!), will favor multinationals who repatriate foreign profits into cheaper dollars.

Relative Strength ofCompared toStrengthQuote Time
NASDAQ-100Dow Industrials  +0.08% Mon Oct 7 16:41:55 2002
NASDAQ-100S&P 500  +0.63% Mon Oct 7 16:41:55 2002
S&P MidCapS&P 500  -0.52% Mon Oct 7 16:32:00 2002
S&P SmallCapS&P 500  -0.94% Mon Oct 7 16:32:00 2002
Value LineS&P 500  -1.04% Mon Oct 7 16:35:29 2002
The market was weak again on Monday, with the Value Line underperforming all of the other major indices (as you can see from the Relative Strength table, the Value Line underperformed the S&Ps by over 1%). Of course, this is a seasonally poor time of year for the Value Line and the broad market: mutual funds tend to sell to realize tax losses in October. But, as the chart shows, there has been a rotation out of the broad market underway since July, and this tells us that the blue chips are gathering strength for a bull market. And, given that October is a seasonally strong month for the stock market, any dip this month is a real buying opportunity to put new cash to work in the blue chip sectors.

The NASDAQ-100 (NDX) Index continues to outperform the others. This is a very positive sign for gains in technology sectors going forward. We believe a sustained bull market will not be possible unless the high-tech stocks can lead the way.

George Dagnino published a new seasonal study of the bond market on Monday. It also supports the case for a bull market in stocks starting soon. Bonds tend to bottom in yield in the last quarter of the year and 2002 is shaping up very much like 2001. Last year, yields bottomed in late October-early November, so rising yields should be a supportive factor for stocks as investors flee the bond market as capital losses remind them that even US Treasury obligations can lose value as quickly as dotcom stocks.

Sentiment was mixed again on Monday: OEX traders were pouring four times as much money into downside protection, but NASDAQ traders were fairly bullish (which is a negative). But, Time Ratio projections point to Tuesday being a turnaround day for stocks this week.

We should see a rally in stocks Tuesday after Bushy gives his address on Iraq Monday night. Much of the late selling in the stock market was due to traders closing out positions ahead of the speech.

Format for printing.

Format for printing. [Go back]

For Monday, October 7, 2002
© Bob Carver
$-Weighted OEX/QQQ Call/Put Ratios: 0.40/0.48
Popular Indices: http://www.marketclues.net/cgi-bin/myclues?chart=/:/indices/d/_spx.4903.html&member=@@ ^SPX · http://www.marketclues.net/cgi-bin/myclues?chart=/:/indices/d/_compq.4903.html&member=@@ ^IXQ · http://www.marketclues.net/cgi-bin/myclues?chart=/:/indices/d/_ndx.4903.html&member=@@ ^NDX · http://www.marketclues.net/cgi-bin/myclues?chart=/:/indices/d/_dj.4903.html&member=@@ ^DJI · http://www.marketclues.net/cgi-bin/myclues?chart=/:/indices/d/_mid.4903.html&member=@@ ^MID · http://www.marketclues.net/cgi-bin/myclues?chart=/:/indices/d/_oex.4903.html&member=@@ ^OEX · http://www.marketclues.net/cgi-bin/myclues?chart=/:/indices/d/_nya.4903.html&member=@@ ^NYA · http://www.marketclues.net/cgi-bin/myclues?chart=/:/indices/d/_vle.4903.html&member=@@ ^VLE · http://www.marketclues.net/cgi-bin/myclues?chart=/:/indices/d/_rut.4903.html&member=@@ ^RUT · http://www.marketclues.net/cgi-bin/myclues?chart=/:/indices/d/_sml.4903.html&member=@@ ^SML · http://www.marketclues.net/cgi-bin/myclues?chart=/:/futures/d/cr_a0.4903.html&member=@@ ^CRB · http://www.marketclues.net/cgi-bin/myclues?chart=/:/indices/d/_xau.4903.html&member=@@ ^XAU · http://www.marketclues.net/cgi-bin/myclues?chart=/:/indices/d/_btk.4903.html&member=@@ ^BTK · http://www.marketclues.net/cgi-bin/myclues?chart=/:/indices/d/_tyx.4903.html&member=@@ ^TYX
Sector Performance Since: 8 Apr 1999 · 18 Oct 1999 · A Week Ago · A Fortnight Ago
Sector Acceleration Since: 8 Apr 1999 · 18 Oct 1999 · A Week Ago · A Fortnight Ago

MyClues Home Page Link ("http://www.marketclues.net/cgi-bin/myclues?myhome=yes&member;[email protected]")

Good News and Bad News on the Economy

The good news from the government: the economy added 711,000 new jobs in September, but businesses reported there were 193,000 jobs lost during the same period.

Huh, does government speak with forked tongue, Kimosabe? Um, yes. The government cannot be believed to accurately report what the economy is doing — they just don't know what the state of the economy is until years later. The employment report comes from two surveys, one of households and one from businesses. The 711,000 new jobs figure is from the household survey, while the 193,000 jobs lost figure is from the survey of businesses. The 193,000 jobs lost figure is derived by subtracting the 150,000 ``phantom jobs'' the government fudges by adding them to the survey figures before reporting them. (Let's see: if everyone fudged similarly on their income tax return, how long before the government figured it out?) Government figures are always fudged. The market simply reacts to them. And, the market reaction is the thing to pay attention to. The market decided it didn't believe the government figures at all, with the result that stocks sold off and bonds rallied.

However, the business survey is the one to pay attention to: with an absolute decline in new jobs created (-43,000 with the fudge factor of 150,000 jobs added back in) the economy is literally falling off a cliff and the clueless government bureaucrats haven't realized it yet. It's the consumer, stupid, who has been holding the economy up! The consumer isn't going to keep buying if they don't have jobs! The markets realize that simple fact, of course, just as they did in the Great Depression — long before the government figured it out. Back then, Republican President Herbert Hoover spouted nonsense about how ``strong the American economy'' was, just like present-day Republican President George Bush spouts the same nonsense.

Now the only question is: ``Who will be the next FDR?''

Productivity Gains Are Killing Jobs

US Economy Needs a Weaker Dollar, More Inflation

With productivity continuing to rise during this recession, businesses are finding it possible to increase production (or keep it level) with fewer workers. Consequently, we are seeing layoffs of personnel and jobs being lost permanently. This is the inevitable result of computerization of business. For years, computer scientists told businesspeople that they would save money in the long run by replacing people with computers. That hadn't been reality for the first few decades of the Computer Revolution, but we now seem to have passed the critical point where computerization is truly paying off for business: workers are being permanently thrown out of work in many industries due to computerization. And, productivity gains from computerization is the culprit.

The only real solution to this problem is a much weaker US Dollar. A weak dollar would force US export prices down (and import prices up, driving up inflation and interest rates), making US businesses more competitive on the world market. Fortuanately for US workers, this is exactly what the technical outlook is for the US Dollar: it has entered a long term bear market that will substantially reduce its value versus foreign currencies. Unfortunately, we are early in the dollar bear market and the US Dollar is still very popular in many foreign quarters. In fact it may be several years before US workers get relief from the overly-expensive US Dollar.

Of course, there's a downside: a falling US dollar inhibits foreign investment in US stocks. On the other hand, it makes US companies more attractive to takeover by foreign investors. This also has huge tax benefits, since foreigners with US assets pay taxes only on earnings produced in the US. US-based companies, however, pay taxes on worldwide earnings. This is why Germany-based Daimler bought US-based Chrysler rather than the other way 'round. It's also why so many US-based companies with worldwide earnings are trying to flee the country (i.e., reset themselves as foreign corporations — the tax benefits are enormous).

IBM could save many billions in taxes simply by relocating to a foreign country, for example. Congress has promised to look into changing these ridiculous tax laws, but are currently sitting on their hands. If Congress does change the laws, it could help create new jobs here in the US. Otherwise, we are likely to see many jobs exported to foreign countries when those multinationals move their corporate headquarters.

Stocks: Again, Good News and Bad News

The stock market hit the skids early Friday after the brief rally on the Employment Report fell apart when traders read between the lines and found an economy still trundling toward the abyss (see above). However, there is a silver lining in the midst of the gray clouds.

That silver lining is the wave structure of the market. Rather than being a wave 4 of 5 as we suggested last time, the current leg down appears to be the final fifth wave down within the bear market. That's the good news. The bad news is that we could see a plunge to 7200 or 6950 by the time this leg is finished. That's especially the case if the New Moon this weekend marks the start of the Iraq War (it could, since Bushy is scheduling an address to the nation Monday). If the War does start this weekend, it would send the market crashing. But, when the progress of the War is confirmed to be good, the market should put in a bottom and rally.

At this point, after a three-year cyclical bear market, sentiment may still be too bullish to say we're at a bottom. NASDAQ traders are the fly in the ointment. Despite a market down virtually all day Friday, QQQ players still poured far more money into call options (bets the market would rally) than into put options until near the close. OEX players were just the opposite, bearish all day and pouring more than twice as much money into puts as calls. We have a Time Ratio Low due in the NASDAQ on Monday and perhaps those day traders will be bearish by then. What does it take to get these guys and gals bearish? A NASDAQ-100 value below 500?

The very volatile action in the market Friday suggests we are very close to the 2/4-year cycle low. If you look at the quarter-hourly charts, you'll note that the market rallies last week formed two arches. It looks very much like the arc of a basketball shot, in fact. With the cycles pointing down like gravity, the rallies are simply falling prey to the force of gravity. This jibes with the floor trader talk which says that while these rallies are starting out with a lot of buying pressure, the bids are pulled just as soon as momentum is lost — there's no follow-through buying. That suggests that one confirmation that the cycles have landed and are behind us will be when we get a rally which fails, but the decline stays above the previous low. You will note that of the last two rallies, the first one did move below the prior low. As of the close Friday, the second rally's downside fall had retraced most of the rally, but had not yet broken below the prior low. We expect it will make a lower low on Monday. But, remember, we'll be looking for a rally which fails, sells off, but fails to drop to a new low before rallying to a higher high. This is, of course, the classic pattern of higher highs and higher lows that will confirm the new bull market.

Commercial traders are mixed on the prospects for stocks. They held 423,661 S&P 500 futures contracts long and 440,113 contract sold short on the Chicago Mercantile Exchange as of the close 1 October. However, on the Chicago Board of Trade, they were actually net bullish the Dow Jones Industrials, holding 18,969 contracts long to only 8,903 sold short.

Euro Currency: http://www.marketclues.net/cgi-bin/myclues?chart=/:/futures/d/ec_a0.4903.html&member=wcorney@keatepartners.com

No real change from last week: the Euro is locked in a trading range until there is some definite sign of change in the economic outlook. Commercials are net short the Euro: 69,993 contracts sold short to 28,511 bought long on the Chicago Mercantile Exchange as of 1 October.

U.S. Dollar Index: http://www.marketclues.net/cgi-bin/myclues?chart=/:/futures/d/dx_a0.4903.html&member=wcorney@keatepartners.com

Dollar Index got a lift from the Employment Report, but remains in the trading range. Commercial traders are net bullish the Dollar Index: 4,921 contracts bought long versus 2,177 contracts sold short on the New York Cotton Exchange as of 1 October.

Canadian Dollar: http://www.marketclues.net/cgi-bin/myclues?chart=/:/futures/d/cd_a0.4903.html&member=wcorney@keatepartners.com

Canadian Dollar remains weak for now, but hasn't broken down below its prior low yet. Commercials are net short the Canadian Dollar: 31,782 contracts sold short versus 17,815 contracts bought long on the Chicago Mercantile Exchange as of 1 October.

S&P Toronto Stock Exchange http://www.marketclues.net/cgi-bin/myclues?chart=/:/indices/d/_sptse.4903.html&member=wcorney@keatepartners.com

The Canadian index broke to a new low on Friday, but is showing bullish divergence on the oscillator. Like the Dow, we're counting this as the last little wave down in the entire bear market sequence, with a turn up due very soon.

Australian Dollar: http://www.marketclues.net/cgi-bin/myclues?chart=/:/futures/d/ad_a0.4903.html&member=wcorney@keatepartners.com

No real change from last week as the trading range continues. Commercial traders are extremely bearish the Australian Dollar: 15,316 contracts sold short versus only 3,843 held long on the Chicago Mercantile Exchange as of 1 October.

Australian All Ordinaries: http://www.marketclues.net/cgi-bin/myclues?chart=/:/indices/d/_aord.4903.html&member=wcorney@keatepartners.com

The All-Ords held above the 30 September low last week, but weakness on Wall Street could be a drag next week. As usual, the Australian stock market is being held hostage by Wall Street, but should outperform once that drag is released.
Australia Business News http://www.abc.net.au/news/business/default.htm
Yahoo! Australia Business News http://au.dailynews.yahoo.com/Full_Coverage/Australian_Economy/

London Financial-Times 100: http://www.marketclues.net/cgi-bin/myclues?chart=/:/indices/d/_ftse.4903.html&member=wcorney@keatepartners.com

The FTSE-100 is showing excellent relative strength compared to Wall Street. This is a good sign of a recovery building in the London market. It's a ball being held underwater, just waiting to be released.

Bonds / Interest Rates:

Interest rates rose sharply on the release of the Employment Report Friday, but upon sober reflection, the net loss of jobs outweighed the headline number and bonds recovered for the rest of the day. However, this ``false alarm'' should be a strong warning to bond investors that, despite the relative safety of bonds when held to maturity, huge capital losses can result from declining bond capital — just like the stock market. And, the risk goes up the longer it is to maturity. Anyone who thinks a 4% or less 10-year note is a ``safe'' investment was probably a prime candidate to buy a dotcom stock in March 2000.

Target 2030 Zero Coupon Bond Fund Quote

Sectors and Individual Stocks (Subscribers Only)

For tables ranking sectors and individual stocks, and links to charts of 3500 individual stocks and sectors, please visit your very own MyClues Home Page[http://www.marketclues.net/cgi-bin/myclues?myhome=yes&member=@@] -- in the CHARTS & RESEARCH section of the page, you will find a wealth of tools for selecting top sectors and stocks, including access to our exclusive realtime, intraday indicators.

For a 3-4 month free trial subscription, click here.

Commodities (Subscribers Only)

For complete charts of commodities, please visit your very own MyClues Home Page[http://www.marketclues.net/cgi-bin/myclues?myhome=yes&member=@@] -- in the CHARTS & RESEARCH section of the page, you will find links to webpages containing links to the following:

For a 3-4 month free trial subscription, click here.

CRB Index: http://www.marketclues.net/cgi-bin/myclues?chart=/:/futures/d/cr_a0.4903.html&member=wcorney@keatepartners.com

As we expected, the CRB Index is in a corrective pattern which should take it back to the long term yellow support line. At that time, it is very likely that the index will turn up and continue much higher.

Format for printing. [Go back]

For Friday, October 4, 2002
© Bob Carver
$-Weighted OEX/QQQ Call/Put Ratios: 0.53/0.52
Popular Indices: http://www.marketclues.net/cgi-bin/myclues?chart=/:/indices/d/_spx.4903.html&member=@@ ^SPX · http://www.marketclues.net/cgi-bin/myclues?chart=/:/indices/d/_compq.4903.html&member=@@ ^IXQ · http://www.marketclues.net/cgi-bin/myclues?chart=/:/indices/d/_ndx.4903.html&member=@@ ^NDX · http://www.marketclues.net/cgi-bin/myclues?chart=/:/indices/d/_dj.4903.html&member=@@ ^DJI · http://www.marketclues.net/cgi-bin/myclues?chart=/:/indices/d/_mid.4903.html&member=@@ ^MID · http://www.marketclues.net/cgi-bin/myclues?chart=/:/indices/d/_oex.4903.html&member=@@ ^OEX · http://www.marketclues.net/cgi-bin/myclues?chart=/:/indices/d/_nya.4903.html&member=@@ ^NYA · http://www.marketclues.net/cgi-bin/myclues?chart=/:/indices/d/_vle.4903.html&member=@@ ^VLE · http://www.marketclues.net/cgi-bin/myclues?chart=/:/indices/d/_rut.4903.html&member=@@ ^RUT · http://www.marketclues.net/cgi-bin/myclues?chart=/:/indices/d/_sml.4903.html&member=@@ ^SML · http://www.marketclues.net/cgi-bin/myclues?chart=/:/futures/d/cr_a0.4903.html&member=@@ ^CRB · http://www.marketclues.net/cgi-bin/myclues?chart=/:/indices/d/_xau.4903.html&member=@@ ^XAU · http://www.marketclues.net/cgi-bin/myclues?chart=/:/indices/d/_btk.4903.html&member=@@ ^BTK · http://www.marketclues.net/cgi-bin/myclues?chart=/:/indices/d/_tyx.4903.html&member=@@ ^TYX
Sector Performance Since: 8 Apr 1999 · 18 Oct 1999 · A Week Ago · A Fortnight Ago
Sector Acceleration Since: 8 Apr 1999 · 18 Oct 1999 · A Week Ago · A Fortnight Ago

MyClues Home Page Link ("http://www.marketclues.net/cgi-bin/myclues?myhome=yes&member;[email protected]")

Stocks: ``Floundering Around''

Bob Pisani (CNBC's NYSE floor reporter) put it best — the market spent the day Thursday just ``floundering around''. That's exactly what happened.

Late on Wednesday, a Bear Stearns employee mistakenly entered a sell program order to sell $4 billion worth of stock — it was supposed to have been $4 million. That order was only partially executed before NYSE officials cancelled all but about $600 million, but the damage to the Dow had been done and it sent the market plunging. On Thursday morning, the market suddenly rallied back to where it should have been (according to the technical pattern it was following late Wednesday). No one was quite sure, but the early rally was most likely a reversal of the previous day's sell program — i.e., a buy program to close the $600 million in short sales mistakenly executed the day before.

In any case, the gains didn't last and the market spent the rest of the day trying to mount a sustainable rally, but couldn't. Instead, it worked its way down in a wedge formation that's scheduled to bottom Friday morning. So, perhaps we'll get a nice rally once the market finishes ``floundering''. We will be looking for a bottom near the bottom line of the short term wedge and in the time frame suggested by our Time Ratio projection.

The SOX index (Semiconductor Sector) was hit by AMD's revenue warning and fell back below the short term support line it had been building since the low last week. The break suggests the low may not be in in this index just yet.

Overall, we're counting the market as being in wave 4 of 5 down from the March Dow Industrials high. We are counting Monday morning's low as the end of wave 3 of 5. Since wave 3 extended, we are looking for the 8000-8016 level to be a strong ceiling on wave 4 rallies — that was the prior lesser-degree wave 4 rally high. However, since this wave 4 is more likely to work sideways in a contracting triangle pattern (wave 2 was a zigzag, so the Rule of Alternation says that wave 4 should be a flat pattern) than any other alternative, the current very short term count is either that we're about halfway through the wave a rally, or (more likely) that the current decline is wave b down. That suggests Friday morning's low should setup a wave c rally to test the week's high. Once we have a couple more waves complete, we should be able to start targeting the time and the general price area for the final wave down, wave 5 of 5. Right now, our best estimate is for that final low to occur right around October 22nd based upon our polytrendline and cycle analysis.

In any case we're rapidly approaching the end of this bear market. This last phase may be the most trying phase for both investors and traders. With the market having no clear trend, it's frustrating for traders. And, for investors, the lack of sustainable rallies saps their morale and they simply wish to see the pain end. That's how a bear market ends, though — with a whimper, not a bang. The bang was in July.

The sentiment numbers support the ``whimper'' hypothesis. After being undyingly bullish for the last few years, those NASDAQ traders in the QQQs are showing signs of wear and tear. They're bearish one day and bullish the next. On the Monday/Tuesday rally they got bullish, but not as bullish as they had on previous declines. And, after just one day of decline, they got overly-bearish. This is definitely a confirming sign of a bear market in a bottoming process.

Format for printing. [Go back]

For Thursday, October 3, 2002
© Bob Carver
$-Weighted OEX/QQQ Call/Put Ratios: 0.49/1.89
Popular Indices: http://www.marketclues.net/cgi-bin/myclues?chart=/:/indices/d/_spx.4903.html&member=@@ ^SPX · http://www.marketclues.net/cgi-bin/myclues?chart=/:/indices/d/_compq.4903.html&member=@@ ^IXQ · http://www.marketclues.net/cgi-bin/myclues?chart=/:/indices/d/_ndx.4903.html&member=@@ ^NDX · http://www.marketclues.net/cgi-bin/myclues?chart=/:/indices/d/_dj.4903.html&member=@@ ^DJI · http://www.marketclues.net/cgi-bin/myclues?chart=/:/indices/d/_mid.4903.html&member=@@ ^MID · http://www.marketclues.net/cgi-bin/myclues?chart=/:/indices/d/_oex.4903.html&member=@@ ^OEX · http://www.marketclues.net/cgi-bin/myclues?chart=/:/indices/d/_nya.4903.html&member=@@ ^NYA · http://www.marketclues.net/cgi-bin/myclues?chart=/:/indices/d/_vle.4903.html&member=@@ ^VLE · http://www.marketclues.net/cgi-bin/myclues?chart=/:/indices/d/_rut.4903.html&member=@@ ^RUT · http://www.marketclues.net/cgi-bin/myclues?chart=/:/indices/d/_sml.4903.html&member=@@ ^SML · http://www.marketclues.net/cgi-bin/myclues?chart=/:/futures/d/cr_a0.4903.html&member=@@ ^CRB · http://www.marketclues.net/cgi-bin/myclues?chart=/:/indices/d/_xau.4903.html&member=@@ ^XAU · http://www.marketclues.net/cgi-bin/myclues?chart=/:/indices/d/_btk.4903.html&member=@@ ^BTK · http://www.marketclues.net/cgi-bin/myclues?chart=/:/indices/d/_tyx.4903.html&member=@@ ^TYX
Sector Performance Since: 8 Apr 1999 · 18 Oct 1999 · A Week Ago · A Fortnight Ago
Sector Acceleration Since: 8 Apr 1999 · 18 Oct 1999 · A Week Ago · A Fortnight Ago

MyClues Home Page Link ("http://www.marketclues.net/cgi-bin/myclues?myhome=yes&member;[email protected]")

Deflation

Knock, Knock, Knockin' on Heaven's Door by Bill Gross ("http://www.pimco.com/"):
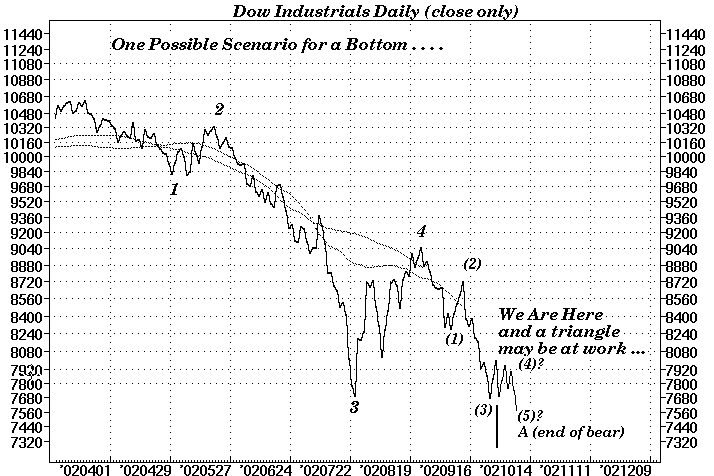
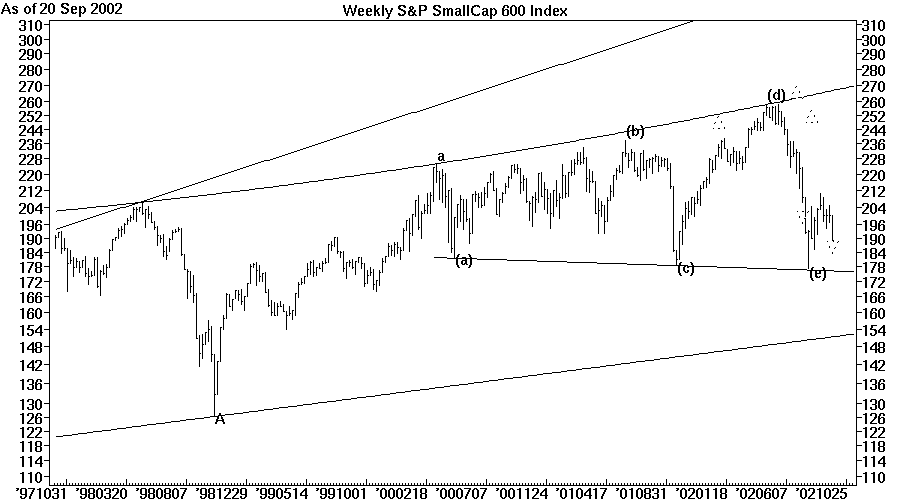
``If the American refinancing boom ends before a new investment boom begins, we are in a world of hurt. Consumption withers, investment rejuvenation will not have begun, and the U.S. global economic locomotive, such as it is, will grind to a halt. How long do we have? Twelve months at the most, even if Greenspan drives rates toward zero.''

If we only have twelve months get an investment boom going again, as Bill Gross says above, it doesn't look good. While we are expecting a cyclical bull market to get started any day now (it may have already started, but we won't know for a few more weeks for sure), we aren't certain it will qualify as the investment boom Mr Gross says we need. Then, again, if the new bull market can reflate the economy, we won't have to worry too much about the housing bubble.

It's interesting to see Gross realize how serious the problem of deflation is. We think the future rising stock market will finally put an end to the problem of deflation in this cycle. The CRB Index has been rising in a new bull market. The CRB Index tends to be a leading indicator for stocks, bottoming many months ahead of stocks, and this is the main reason we think the problem of deflation has been, and will be, solved.

Stocks: Dow Jones Falters

News had nothing to do with either Tuesday's rally or Wednesday's selloff. The real reason the market went up and down is day trading. The market initially fell on profit-taking Wednesday morning, then rebounded but lost momentum in the afternoon as the Dow Jones Industrials' quote feed failed (it was down for about 45 minutes). This seemed to put a damper on the rally and the market drifted down, then eventually dropped sharply lower. Up until then, the market had showed some bullish tendencies, but after the quote feed was restored, hedge funds started aggressively selling the Dow Jones (DJ) futures and the rest of the market started tumbling with it. We got a much-delayed sell signal due to the quote feed failure and decided to wait for a rebound rally to sell due to heightened risk factors. The rebound rally never materialized due to that hedge fund selling.

The selloff was on very light volume as you might expect from a futures-initiated plunge. What we're seeing is the exact opposite of a Plunge Protection Team maneuver to prop up stock prices. When the PPT (an arm of the US Treasury Department) decides to support stock prices, they buy quantities of Dow Jones futures contracts on the Chicago exchange, causing those prices to rise relative to the individual stocks which make up the average. Arbitrageurs then make a riskless profit by buying cheap stocks (they are cheap relative to the implied value of the futures) and selling futures contracts short. Then, when the Dow Jones Average rallies, it causes sympathy buying on the floor of the NYSE, creating a rally in the overall market simply because everyone watches what the Dow is doing.

When hedge funds sell futures contracts short, as they did Wednesday afternoon, they create the exact opposite effect: arbitrageurs can then make riskless profits by buying futures and selling the underlying stocks in the average short. That sends the Dow Jones Average plunging and the rest of the market follows to the downside. It's all smoke and mirrors to generate riskless profits. The market gave back about half of its gains this week and should find support in the general price area of the close.

Things are looking up in certain sectors, such as the Semiconductor and Biotechnology sectors. The SOX index may have put in its bear market bottom a week ago. It broke above last week's high on Wednesday morning (before the afternoon hedge fund games got going). And, BTK made its low in July and has remained well above its long term support line (shown in yellow on the weekly chart). Leading sectors bottom first in a bull market, well before the headline indices like the Dow.

So, it's two inches up and one inch down as the snail climbs the greased pole. We are probably very close to a bear market bottom, but that's something that will only be clear in hindsight.

Format for printing. [Go back]

For Wednesday, October 2, 2002
© Bob Carver
$-Weighted OEX/QQQ Call/Put Ratios: 0.62/1.09
Popular Indices: http://www.marketclues.net/cgi-bin/myclues?chart=/:/indices/d/_spx.4903.html&member=@@ ^SPX · http://www.marketclues.net/cgi-bin/myclues?chart=/:/indices/d/_compq.4903.html&member=@@ ^IXQ · http://www.marketclues.net/cgi-bin/myclues?chart=/:/indices/d/_ndx.4903.html&member=@@ ^NDX · http://www.marketclues.net/cgi-bin/myclues?chart=/:/indices/d/_dj.4903.html&member=@@ ^DJI · http://www.marketclues.net/cgi-bin/myclues?chart=/:/indices/d/_mid.4903.html&member=@@ ^MID · http://www.marketclues.net/cgi-bin/myclues?chart=/:/indices/d/_oex.4903.html&member=@@ ^OEX · http://www.marketclues.net/cgi-bin/myclues?chart=/:/indices/d/_nya.4903.html&member=@@ ^NYA · http://www.marketclues.net/cgi-bin/myclues?chart=/:/indices/d/_vle.4903.html&member=@@ ^VLE · http://www.marketclues.net/cgi-bin/myclues?chart=/:/indices/d/_rut.4903.html&member=@@ ^RUT · http://www.marketclues.net/cgi-bin/myclues?chart=/:/indices/d/_sml.4903.html&member=@@ ^SML · http://www.marketclues.net/cgi-bin/myclues?chart=/:/futures/d/cr_a0.4903.html&member=@@ ^CRB · http://www.marketclues.net/cgi-bin/myclues?chart=/:/indices/d/_xau.4903.html&member=@@ ^XAU · http://www.marketclues.net/cgi-bin/myclues?chart=/:/indices/d/_btk.4903.html&member=@@ ^BTK · http://www.marketclues.net/cgi-bin/myclues?chart=/:/indices/d/_tyx.4903.html&member=@@ ^TYX
Sector Performance Since: 8 Apr 1999 · 18 Oct 1999 · A Week Ago · A Fortnight Ago
Sector Acceleration Since: 8 Apr 1999 · 18 Oct 1999 · A Week Ago · A Fortnight Ago

MyClues Home Page Link ("http://www.marketclues.net/cgi-bin/myclues?myhome=yes&member;[email protected]")

Stocks: Buyers Are Back

The market recovered most of its losses since last Thursday as the buyers returned. Last week, we said:

Investors were wary of holding stocks over the weekend and they not only sold some of the stocks they'd bought earlier in the week on Friday, they deferred new buying to next week. That provided an air pocket under the market and the Dow gave up virtually all of its Wednesday/Thursday rally gains. We call this phenomena ``Selling to the Sleeping Point'' and we don't blame them at all.

It's very likely that the market will bounce on Monday for two reasons:

  1. Monday is the last day of the quarter, a day which often sees portfolio managers buying shares to prop up prices for the end of quarter portfolio ``snapshot''.

  2. If we get through the weekend without a war or major scandal, those buyers who pulled their bids on Friday are likely to reinstate them on Monday.

Although the bounceback rally didn't start until the second hour of trading Monday and didn't accelerate until Tuesday afternoon, the buyers have definitely come back.

We think we've very close to the real bear market bottom now. One of the most beaten-up sectors has been the Semiconductor Sector, represented by the SOX index. That index is one of the few which did not make a new low on the recent dip. It definitely looks sold out here and is probably a value play to savvy investors, along with the Biotechs, which we mentioned yesterday.

Speaking of the Biotechs, a helpful reader wrote to say that the HOLDRS Biotech stock was difficult to trade anywhere, not just at FOLIOfn. He suggested that there is a stock alternative which does trade on FOLIOfn which represents the sector. It's IBB (ISHARES TR NASDQ BIO INDX). Of course, at FOLIOfn, you can build a diversified portfolio of individual biotech stocks (as well as any of the 3500 stocks in the Window List).

The market is trading in a range here and is likely to be volatile over the next week until we reach that final bear market bottom. However, we continue to believe the risk on the downside is small compared to the potential reward of holding a basket of stocks or indices (as we do).

Format for printing. [Go back]

For Tuesday, October 1, 2002
© Bob Carver
$-Weighted OEX/QQQ Call/Put Ratios: 0.30/0.27
Popular Indices: http://www.marketclues.net/cgi-bin/myclues?chart=/:/indices/d/_spx.4903.html&member=@@ ^SPX · http://www.marketclues.net/cgi-bin/myclues?chart=/:/indices/d/_compq.4903.html&member=@@ ^IXQ · http://www.marketclues.net/cgi-bin/myclues?chart=/:/indices/d/_ndx.4903.html&member=@@ ^NDX · http://www.marketclues.net/cgi-bin/myclues?chart=/:/indices/d/_dj.4903.html&member=@@ ^DJI · http://www.marketclues.net/cgi-bin/myclues?chart=/:/indices/d/_mid.4903.html&member=@@ ^MID · http://www.marketclues.net/cgi-bin/myclues?chart=/:/indices/d/_oex.4903.html&member=@@ ^OEX · http://www.marketclues.net/cgi-bin/myclues?chart=/:/indices/d/_nya.4903.html&member=@@ ^NYA · http://www.marketclues.net/cgi-bin/myclues?chart=/:/indices/d/_vle.4903.html&member=@@ ^VLE · http://www.marketclues.net/cgi-bin/myclues?chart=/:/indices/d/_rut.4903.html&member=@@ ^RUT · http://www.marketclues.net/cgi-bin/myclues?chart=/:/indices/d/_sml.4903.html&member=@@ ^SML · http://www.marketclues.net/cgi-bin/myclues?chart=/:/futures/d/cr_a0.4903.html&member=@@ ^CRB · http://www.marketclues.net/cgi-bin/myclues?chart=/:/indices/d/_xau.4903.html&member=@@ ^XAU · http://www.marketclues.net/cgi-bin/myclues?chart=/:/indices/d/_btk.4903.html&member=@@ ^BTK · http://www.marketclues.net/cgi-bin/myclues?chart=/:/indices/d/_tyx.4903.html&member=@@ ^TYX
Sector Performance Since: 8 Apr 1999 · 18 Oct 1999 · A Week Ago · A Fortnight Ago
Sector Acceleration Since: 8 Apr 1999 · 18 Oct 1999 · A Week Ago · A Fortnight Ago

MyClues Home Page Link ("http://www.marketclues.net/cgi-bin/myclues?myhome=yes&member;[email protected]")

Some Folks on the Fed Get It, At Least
Federal Reserve Bank of Dallas President Robert McTeer, who pushed unsuccessfully for lower interest rates at a Fed policy meeting last week, said on Monday it was essential for the U.S. economy to grow faster. He notes that while productivity growth in the late 'Nineties allowed the economy to grow faster without kicking up inflation, the flip side of high productivity today is that it is a drag on the economy. That's because businesses can lay off workers and still maintain production levels. Given that, rising productivity during a recession may actually create the conditions for a deflationary spiral which kicks the economy into a depression (that's our interpretation of what he said, reading between the lines). McTeer is a leading candidate to replace Fed Chairman Alan Greenspan after he retires. Here's hoping the pols in Washington wise up before it's too late.
Roach Looking For Two More Years of Recession
Stephen Roach appeared on Bubble-TV Monday afternoon and stated that his bleak outlook for the economy continues. He sees Europe in worse shape than the US, which should be very bearish for the Euro versus the US Dollar. But, he sees the real estate bubble bursting, the consumer bubble bursting and corporate layoffs increasing over the next couple of years as the correction from the excesses of recent decades continues to take a toll on the US. Roach correctly called the current recession — even its current ``double dip'' — and is looking for a ``triple-dip'' before it's finished.

Stocks: ``Most Oversold Levels in History''

The market slide which started on Friday continued during the first hour of trading on Wall Street Monday, but found a bottom in the second hour. In fact, the Dow put in a decent bounce on Monday, rising all the way back to fill the gap in prices which formed on the opening.

Despite Monday being the last day of the quarter, Window Dressing was not enough to prop up the market.

A couple of analysts pointed out recently that the stock market has reached historic oversold levels. Jerry Favors mentioned that the Monthly RSI indicator, a momentum oscillator, was near record low levels which have historically preceded significant bear market bottoms, such as 1932, 1942, 1962, 1966 and 1974. The bad news on that front is that these low levels on the RSI indicator tended to come several weeks before the absolute price low.

The other analyst we heard was Richard Arms, who created the well-known and widely-used Arms Index (formerly called TRIN). He mentioned on BubbleTV that the 200-day Arms Index was at a historic oversold level. Again, this is likely not the bottom, but a necessary condition before the real price bottom.

Sentiment zoomed into the overly-bearish category on Monday as both the QQQ and OEX traders rushed to the safety of puts. This is constructive for a short term bottom, but we need to see some bullish divergence in this indicator.

Biotech Index Leading the Way Up?
At the bottom of a bear market, the leading stocks and leading sectors are the first to start moving up as they resist the downside pull. We are seeing signs that our recent bottom call in the
Biotech Index may have been correct. The index not only didn't fall on Monday, it actually closed with a 0.82% gain! This may once again be the leading sector (note that this index was the leading sector in the 'Nineties and still retains fabulous gains from that era). And, there is an exchange-traded fund which specializes in this sector: Merrill Lynch's Biotech HOLDRS BBH. Unfortunately, that stock doesn't seem to be available on FOLIOfn.com.
Short Term
The market is still trying to put in a bottom, which may be wave 3 of 5 down, or it could be the final bottom with a retest in mid-November. See our Trading Page for intraday commentary on Tuesday as this market lurches toward a bear market bottom.

Format for printing. [Go back]

For Monday, September 30, 2002
© Bob Carver
$-Weighted OEX/QQQ Call/Put Ratios: 0.39/1.08
Popular Indices: http://www.marketclues.net/cgi-bin/myclues?chart=/:/indices/d/_spx.4903.html&member=@@ ^SPX · http://www.marketclues.net/cgi-bin/myclues?chart=/:/indices/d/_compq.4903.html&member=@@ ^IXQ · http://www.marketclues.net/cgi-bin/myclues?chart=/:/indices/d/_ndx.4903.html&member=@@ ^NDX · http://www.marketclues.net/cgi-bin/myclues?chart=/:/indices/d/_dj.4903.html&member=@@ ^DJI · http://www.marketclues.net/cgi-bin/myclues?chart=/:/indices/d/_mid.4903.html&member=@@ ^MID · http://www.marketclues.net/cgi-bin/myclues?chart=/:/indices/d/_oex.4903.html&member=@@ ^OEX · http://www.marketclues.net/cgi-bin/myclues?chart=/:/indices/d/_nya.4903.html&member=@@ ^NYA · http://www.marketclues.net/cgi-bin/myclues?chart=/:/indices/d/_vle.4903.html&member=@@ ^VLE · http://www.marketclues.net/cgi-bin/myclues?chart=/:/indices/d/_rut.4903.html&member=@@ ^RUT · http://www.marketclues.net/cgi-bin/myclues?chart=/:/indices/d/_sml.4903.html&member=@@ ^SML · http://www.marketclues.net/cgi-bin/myclues?chart=/:/futures/d/cr_a0.4903.html&member=@@ ^CRB · http://www.marketclues.net/cgi-bin/myclues?chart=/:/indices/d/_xau.4903.html&member=@@ ^XAU · http://www.marketclues.net/cgi-bin/myclues?chart=/:/indices/d/_btk.4903.html&member=@@ ^BTK · http://www.marketclues.net/cgi-bin/myclues?chart=/:/indices/d/_tyx.4903.html&member=@@ ^TYX
Sector Performance Since: 8 Apr 1999 · 18 Oct 1999 · A Week Ago · A Fortnight Ago
Sector Acceleration Since: 8 Apr 1999 · 18 Oct 1999 · A Week Ago · A Fortnight Ago

MyClues Home Page Link ("http://www.marketclues.net/cgi-bin/myclues?myhome=yes&member;[email protected]")

Stocks: Selling to the Sleeping Point

Investors were wary of holding stocks over the weekend and they not only sold some of the stocks they'd bought earlier in the week on Friday, they deferred new buying to next week. That provided an air pocket under the market and the Dow gave up virtually all of its Wednesday/Thursday rally gains. We call this phenomena ``Selling to the Sleeping Point'' and we don't blame them at all.

It's very likely that the market will bounce on Monday for two reasons:

  1. Monday is the last day of the quarter, a day which often sees portfolio managers buying shares to prop up prices for the end of quarter portfolio ``snapshot''.

  2. If we get through the weekend without a war or major scandal, those buyers who pulled their bids on Friday are likely to reinstate them on Monday.

But, we're not out of the woods yet. The 2/4-year cycle is still due to land in the near future. And, we have two long term timeframes to watch as far as Time Ratios are concerned:

  1. October 11th comes up as a low on several projections using the broad market. This could be the absolute price low for the bear market. It's also, almost to the day, the 12th anniversary of the October 1990 low which preceded the last War on Iraq. In 1990, the market declined from the time Iraq invaded Kuwait in July until mid-October, anticipating a war. Then, in mid-October, with stocks sold out, the market started gradually moving up into early January. A brief dip in January preceded the actual outbreak of hostilities. When the bombs started falling, the bond market started rallying, with the stock market turning around almost immediately and rallying sharply higher. Now, we realize history will never repeat exactly, but this situation looks pretty close to rhyming.

  2. Mid-November also shows up as a low projection for the blue chip indices. This may be a lower low, but we doubt it. It should be a retest of whatever price low we make in the next two weeks.

Thus, we should have ample buying opportunities in individual stocks in the next couple of months. For now, we are going to concentrate on stock market indices because there are still a lot of individual issues which carry substantial risk in this market. When we get past this cycle low, we think individual stock-picking will once again be a good strategy to employ for outsized gains in the coming year.

On an Elliott Wave basis, we could be close in time and form to the ultimate price low in this cyclic bear market. One possible (and less bearish than many) scenario which could be seen is shown in the chart below:

Now, the scenario shown above is a sort of ``best-case'' — it could be much worse, price-wise. However, we are getting very close in time to the bottom, so we have to be aware of all possibilities.

A more bearish possibility is a substantial breakdown below the July lows (the scenario above targets the 7500 price area, approximately, on the Dow for a final low). A more bearish scenario has the Dow dropping back to the 1994 trading range (3500-3600) before a final low is seen. During a panic decline, since prices are set by the last buyer, the market can become extraordinarily undervalued. Every investor should realize that such periods are not the norm, but they do occur from time to time. If you are ready to buy such emotional bottoms, you will find it can be quite rewarding over the long run (even, sometimes, over the short run). As the saying goes, ``buy when blood is running in the streets.''

We may or may not get such a panic. In any case, we should see the market rebound next week (barring a surprise which blindsides the market over the weekend). In addition to the factors outlined above, we saw the Dow and S&Ps take the brunt of the selling pressure on Friday: the NASDAQ simply went back to test Thursday's lows, remaining well above last week's price lows. In fact, the SOX (Semiconductor Index) showed even greater relative strength on the selloff. Since every bear market in the last thirty years has ended when high-tech stocks bottomed first, we think the strength seen in the high-tech sectors is a sign of things to come — whether we get a panic in the meantime or not.

As far as hedging is concerned, we expect a rebound rally and are very likely to put on some hedge in the futures on that rally in the next week.

A Note on the Recession

The News of its Demise is Very Premature
There seems to be widespread confusion among the press and Bubble-TV economists. They seem to think the recession ended some time back. Somebody give these people a cluestick: the recession is ongoing — into its third year, in fact. The recession likely started in October 2000, six months after the stock market topped out and entered this bear market. And, a couple of quarters of positive GDP growth does not qualify to allow them to declare it at an end! To do so is simply sloppy and unprofessional. The
NBER is the official agency which will declare the recession over and it has most definitely not done so yet. It's obvious that despite a nominally-positive GDP, the unemployment rate is rising and companies are still not producing any net new jobs. Many states' unemployment compensation funds are running out of money and they're having to borrow money from the Federal government to pay unemployment claims.

The stock market knows: this is an ongoing recession accompanied by an ongoing bear market. The stock market is not out of sync with the economy — it's the media that's out of sync with reality. It's also the Bush Administration that's clueless about the economy (just like Bush Sr, Bush Jr seems to rely too much on the judgement of incompetent advisors). And, this will be the downfall for the Republicans: to win the war (on Iraq) and lose the reins of power.

Euro Currency: http://www.marketclues.net/cgi-bin/myclues?chart=/:/futures/d/ec_a0.4903.html&member=wcorney@keatepartners.com

No real change over the week: the Euro is in a sideways correction. Since the European economy is clearly in worse shape than the US, we don't see a great deal of upside pressure in the Euro.

U.S. Dollar Index: http://www.marketclues.net/cgi-bin/myclues?chart=/:/futures/d/dx_a0.4903.html&member=wcorney@keatepartners.com

Like the Euro, the Dollar is in a trading range. The wedge shown in the Weekly Dollar Index Chart should continue to trace within the long term support and resistance lines shown. A break out of that range in either the upside direction (less likely) or the downside direction (more likely) would signal a new trending move in the index.

Canadian Dollar: http://www.marketclues.net/cgi-bin/myclues?chart=/:/futures/d/cd_a0.4903.html&member=wcorney@keatepartners.com

Treading water, like the Dollar and the Euro, but could be subject to a substantial decline if recent lows are broken.

S&P Toronto Stock Exchange http://www.marketclues.net/cgi-bin/myclues?chart=/:/indices/d/_sptse.4903.html&member=wcorney@keatepartners.com

The Toronto Stock Exchange Index is still tracking movements in the Dow. It is testing summer lows. As long as the Dow is able to ``circle the wagons'' here, the Canadian market should continue in this range.

Australian Dollar: http://www.marketclues.net/cgi-bin/myclues?chart=/:/futures/d/ad_a0.4903.html&member=wcorney@keatepartners.com

The A$ has been stuck in a consolidation range after dropping in five waves. This is not bullish. If we get a breakdown out of this consolidation, it would be either a wave C down in the correction which started in June — or a wave 3 plunge to new lows.

Australian All Ordinaries: http://www.marketclues.net/cgi-bin/myclues?chart=/:/indices/d/_aord.4903.html&member=wcorney@keatepartners.com

We're now in the timeframe for a long term low and the beginning of a bull market. Time will tell, but we think this could be the bottom.
Australia Business News http://www.abc.net.au/news/business/default.htm
Yahoo! Australia Business News http://au.dailynews.yahoo.com/Full_Coverage/Australian_Economy/

London Financial-Times 100: http://www.marketclues.net/cgi-bin/myclues?chart=/:/indices/d/_ftse.4903.html&member=wcorney@keatepartners.com

The London market tested summer lows last week and rallied. It closed before the pre-weekend selling got started in earnest on Wall Street, so it may give some of last week's rally back on Monday morning. Since we think we'll see a recovery on Wall Street, the FTSE-100 is likely to maintain a positive tilt in the trend.

Bonds / Interest Rates:

Bonds sold off from their midweek highs, but rebounded on Friday as stocks sold off. The rebound rally appears to be running out of steam and should provide some help to the stock market next week when bonds drop back. Funds flows out of bonds and into stocks should help lay the foundation for the stock bull market to come.

Target 2030 Zero Coupon Bond Fund Quote

Sectors and Individual Stocks (Subscribers Only)

For tables ranking sectors and individual stocks, and links to charts of 3500 individual stocks and sectors, please visit your very own MyClues Home Page[http://www.marketclues.net/cgi-bin/myclues?myhome=yes&member=@@] -- in the CHARTS & RESEARCH section of the page, you will find a wealth of tools for selecting top sectors and stocks, including access to our exclusive realtime, intraday indicators.

For a 3-4 month free trial subscription, click here.

Commodities (Subscribers Only)

For complete charts of commodities, please visit your very own MyClues Home Page[http://www.marketclues.net/cgi-bin/myclues?myhome=yes&member=@@] -- in the CHARTS & RESEARCH section of the page, you will find links to webpages containing links to the following:

For a 3-4 month free trial subscription, click here.

CRB Index: http://www.marketclues.net/cgi-bin/myclues?chart=/:/futures/d/cr_a0.4903.html&member=wcorney@keatepartners.com

Commodity prices are consolidating just under the old highs. This is bullish and implies higher prices to come once resistance is broken through. So far, most of the gains in the CRB have come in the energy complex and the grains (due to the drought). The industrials metals have been weak. However, Copper appears to be very close to a low and ready to provide some help to push commodity prices higher in the near future. This should nail shut the case for deflation, a factor which has been holding the economy and the stock market hostage. A turn up in Copper prices is also likely to signal a more important downtrend in the bond market.

Format for printing. [Go back]

For Friday, September 27, 2002
© Bob Carver
$-Weighted OEX/QQQ Call/Put Ratios: 1.07/1.88
Popular Indices: http://www.marketclues.net/cgi-bin/myclues?chart=/:/indices/d/_spx.4903.html&member=@@ ^SPX · http://www.marketclues.net/cgi-bin/myclues?chart=/:/indices/d/_compq.4903.html&member=@@ ^IXQ · http://www.marketclues.net/cgi-bin/myclues?chart=/:/indices/d/_ndx.4903.html&member=@@ ^NDX · http://www.marketclues.net/cgi-bin/myclues?chart=/:/indices/d/_dj.4903.html&member=@@ ^DJI · http://www.marketclues.net/cgi-bin/myclues?chart=/:/indices/d/_mid.4903.html&member=@@ ^MID · http://www.marketclues.net/cgi-bin/myclues?chart=/:/indices/d/_oex.4903.html&member=@@ ^OEX · http://www.marketclues.net/cgi-bin/myclues?chart=/:/indices/d/_nya.4903.html&member=@@ ^NYA · http://www.marketclues.net/cgi-bin/myclues?chart=/:/indices/d/_vle.4903.html&member=@@ ^VLE · http://www.marketclues.net/cgi-bin/myclues?chart=/:/indices/d/_rut.4903.html&member=@@ ^RUT · http://www.marketclues.net/cgi-bin/myclues?chart=/:/indices/d/_sml.4903.html&member=@@ ^SML · http://www.marketclues.net/cgi-bin/myclues?chart=/:/futures/d/cr_a0.4903.html&member=@@ ^CRB · http://www.marketclues.net/cgi-bin/myclues?chart=/:/indices/d/_xau.4903.html&member=@@ ^XAU · http://www.marketclues.net/cgi-bin/myclues?chart=/:/indices/d/_btk.4903.html&member=@@ ^BTK · http://www.marketclues.net/cgi-bin/myclues?chart=/:/indices/d/_tyx.4903.html&member=@@ ^TYX
Sector Performance Since: 8 Apr 1999 · 18 Oct 1999 · A Week Ago · A Fortnight Ago
Sector Acceleration Since: 8 Apr 1999 · 18 Oct 1999 · A Week Ago · A Fortnight Ago

MyClues Home Page Link ("http://www.marketclues.net/cgi-bin/myclues?myhome=yes&member;[email protected]")

New article from Elliott Wave International (free registration for Club Elliott Wave is required):

Is the Worst Over?

In this excerpt from this month's Elliott Wave Theorist, Bob Prechter writes about the public's persistence and bullishness. Is their confidence justified or is it just irrational optimism? Read for yourself as Bob explains the technical indicators and wave counts for the current market. The media believes the worst is over, but we know it's not.

Stocks: Blue Chip Rally Limps Higher

As Dan Ascani said Thursday afternoon, ``Any rally that occurs on lighter volume, poor or flat breadth, and that doesn't broaden out is not the new kickoff. When the 4-year cycle releases, the kickoff rally will look MUCH better than the robotic-type of rally we're seeing today (the market is almost going up because it feels it HAS to bounce somewhere, ya know! :)''

Unfortunately, Dan is right. The rally, which missed putting the Dow over the magical 8000 mark by a hair, really wasn't impressive — definitely not a kickoff in a new bull market — and even saw the NASDAQ end on the downside. Although breadth on the NYSE was ``decent'' at an advance-decline ratio of 2.87 (this is the ratio obtained by dividing the number of stocks which gained on the day by the number of stocks which declined), the volume ratio (volume in advancing issues divided by volume in declining issues) was only 2.46, a very poor value. Typically, if we were in the kickoff rally in a new bull market, that ratio would be 9.00 or higher.

Moreover, that negative view is confirmed in the NASDAQ in spades. There, the advance-decline ratio was 1.18, a mediocre reading, while the volume ratio was a puny 0.43, indicating the bulk of the volume was concentrated in issues going down! That's a very bearish sign.

Add to the above the poor sentiment: QQQ option players bet about twice as much that the NASDAQ-100 Index (NDX) would rise (it actually fell). Things hadn't been looking too healthy in NASDAQ sentiment lately, but this reading really shows just how far from a real bottom in NASDAQ we are. When option players buy calls (upside bets) on dips, they have bought the bullish case hook, line and sinker! And, it's likely their accounts will sink.

We're still cautious and looking to hedge our investment long position when the rally runs out of steam. That could be as early as Friday, but with the seasonal tendency for the market to rise into quarter end (not to mention the traditional month-end Monthly Buying Spree), the possibility that the market will continue to levitate cannot be ruled out before next week.

If you can't hedge, we'd suggest raising cash (selling) until things look more bullish for a sustainable rally.

Format for printing. [Go back]

For Thursday, September 26, 2002
© Bob Carver
$-Weighted OEX/QQQ Call/Put Ratios: 0.79/2.19
Popular Indices: http://www.marketclues.net/cgi-bin/myclues?chart=/:/indices/d/_spx.4903.html&member=@@ ^SPX · http://www.marketclues.net/cgi-bin/myclues?chart=/:/indices/d/_compq.4903.html&member=@@ ^IXQ · http://www.marketclues.net/cgi-bin/myclues?chart=/:/indices/d/_ndx.4903.html&member=@@ ^NDX · http://www.marketclues.net/cgi-bin/myclues?chart=/:/indices/d/_dj.4903.html&member=@@ ^DJI · http://www.marketclues.net/cgi-bin/myclues?chart=/:/indices/d/_mid.4903.html&member=@@ ^MID · http://www.marketclues.net/cgi-bin/myclues?chart=/:/indices/d/_oex.4903.html&member=@@ ^OEX · http://www.marketclues.net/cgi-bin/myclues?chart=/:/indices/d/_nya.4903.html&member=@@ ^NYA · http://www.marketclues.net/cgi-bin/myclues?chart=/:/indices/d/_vle.4903.html&member=@@ ^VLE · http://www.marketclues.net/cgi-bin/myclues?chart=/:/indices/d/_rut.4903.html&member=@@ ^RUT · http://www.marketclues.net/cgi-bin/myclues?chart=/:/indices/d/_sml.4903.html&member=@@ ^SML · http://www.marketclues.net/cgi-bin/myclues?chart=/:/futures/d/cr_a0.4903.html&member=@@ ^CRB · http://www.marketclues.net/cgi-bin/myclues?chart=/:/indices/d/_xau.4903.html&member=@@ ^XAU · http://www.marketclues.net/cgi-bin/myclues?chart=/:/indices/d/_btk.4903.html&member=@@ ^BTK · http://www.marketclues.net/cgi-bin/myclues?chart=/:/indices/d/_tyx.4903.html&member=@@ ^TYX
Sector Performance Since: 8 Apr 1999 · 18 Oct 1999 · A Week Ago · A Fortnight Ago
Sector Acceleration Since: 8 Apr 1999 · 18 Oct 1999 · A Week Ago · A Fortnight Ago

MyClues Home Page Link ("http://www.marketclues.net/cgi-bin/myclues?myhome=yes&member;[email protected]")

Stocks: Bulls Take the Market Up

The bulls pushed the market back up the hill Wednesday, but the internals did not confirm that we have seen the final bottom just yet. Although we remain bullish on the next few weeks and mostly fully-invested in investment accounts, the poor internals on the rally have us looking to re-establish short futures hedges to guard against possible downside action over the next few days.

The very positive Money Flow into stocks we saw on Tuesday (despite it being a down day) was not confirmed on Wednesday's rally. This usually means that the market was rising mostly on forced buying as short sellers were compelled to close short positions, or short-covering as it's called. Each dip saw an increase in volume, while rises were on light volumes — not a bullish pattern and suggestive that this little move is a reaction against what is likely still a downtrend — thus our desire to hedge.

Breadth was OK, but not outstanding, with neither the NYSE nor the NASDAQ able to show anything impressive. We had an advance-decline ratio on the NYSE of 2.30, but for a Dow up 158 points, that's not that good. NDX (NASDAQ-100) was up 4.3%, but the NASDAQ market as a whole was only able to show an advance-decline ratio of 1.86, which indicates that the advance by the generals of NDX was not being confirmed by the rank-and-file troops of the NASDAQ exchange.

Sentiment is a worrisome component of Wednesday's rally. While the OEX players are still relatively bearish, spending only about 79¢ on upside bets for each $1 spent on downside bets, the QQQ players were buying $2.19 in calls for each $1 spent on puts. That level of speculation on the upside suggests they might be a bit early in calling a rally that will last more than a day or two.

The best Elliott Wave count we have to offer is that this rally is a wave 4 within the overall decline from August (we count the entire decline as wave B, with a strong wave C rally coming up soon). If that's the correct short term count, we should see Dow resistance at 7914 and just above. That area contains the opening gap down from the 23rd, a gap that has yet to be filled. It also represents the prior fourth wave high, generally a place where resistance is strong. A similar area exists on the SPX (S&P 500 Index) at 847. These levels are marked on the quarter-hourly index charts.

Unless things change, we'll be looking to re-short the December Dow futures Thursday to hedge against further downside in the coming days. Remember, October 4th (a week from Friday) is the effective date of the next new moon, a time of the month which typically sees air attacks commence. Thus, it represents a potential source of news that could catalyze a crash. We're not predicting a war to break out on the next new moon, but it certainly is a strong possibility. During the last new moon, about 100 coalition jets pounded an Iraqi air base and that kind of attack can certainly happen again this month. Please note that the actual new moon occurs on October 6th, a Sunday, and thus we refer to the preceding market day as the ``effective'' date.

We are comfortable being invested in the market as long as we can hedge against outsized downside risks. That pretty well describes this market: downside risk is high, but a good rally is warming up in the wings.

Format for printing. [Go back]

For Wednesday, September 25, 2002
© Bob Carver
$-Weighted OEX/QQQ Call/Put Ratios: 0.64/2.35
Popular Indices: http://www.marketclues.net/cgi-bin/myclues?chart=/:/indices/d/_spx.4903.html&member=@@ ^SPX · http://www.marketclues.net/cgi-bin/myclues?chart=/:/indices/d/_compq.4903.html&member=@@ ^IXQ · http://www.marketclues.net/cgi-bin/myclues?chart=/:/indices/d/_ndx.4903.html&member=@@ ^NDX · http://www.marketclues.net/cgi-bin/myclues?chart=/:/indices/d/_dj.4903.html&member=@@ ^DJI · http://www.marketclues.net/cgi-bin/myclues?chart=/:/indices/d/_mid.4903.html&member=@@ ^MID · http://www.marketclues.net/cgi-bin/myclues?chart=/:/indices/d/_oex.4903.html&member=@@ ^OEX · http://www.marketclues.net/cgi-bin/myclues?chart=/:/indices/d/_nya.4903.html&member=@@ ^NYA · http://www.marketclues.net/cgi-bin/myclues?chart=/:/indices/d/_vle.4903.html&member=@@ ^VLE · http://www.marketclues.net/cgi-bin/myclues?chart=/:/indices/d/_rut.4903.html&member=@@ ^RUT · http://www.marketclues.net/cgi-bin/myclues?chart=/:/indices/d/_sml.4903.html&member=@@ ^SML · http://www.marketclues.net/cgi-bin/myclues?chart=/:/futures/d/cr_a0.4903.html&member=@@ ^CRB · http://www.marketclues.net/cgi-bin/myclues?chart=/:/indices/d/_xau.4903.html&member=@@ ^XAU · http://www.marketclues.net/cgi-bin/myclues?chart=/:/indices/d/_btk.4903.html&member=@@ ^BTK · http://www.marketclues.net/cgi-bin/myclues?chart=/:/indices/d/_tyx.4903.html&member=@@ ^TYX
Sector Performance Since: 8 Apr 1999 · 18 Oct 1999 · A Week Ago · A Fortnight Ago
Sector Acceleration Since: 8 Apr 1999 · 18 Oct 1999 · A Week Ago · A Fortnight Ago

MyClues Home Page Link ("http://www.marketclues.net/cgi-bin/myclues?myhome=yes&member;[email protected]")

New article from Elliott Wave International (free registration for Club Elliott Wave is required):

Is the Worst Over?

In this excerpt from this month's Elliott Wave Theorist, Bob Prechter writes about the public's persistence and bullishness. Is their confidence justified or is it just irrational optimism? Read for yourself as Bob explains the technical indicators and wave counts for the current market. The media believes the worst is over, but we know it's not.

Stocks: Fed Stumbles Again

The Federal Reserve proved themselves inept again this month as they declined to lower short term interest rates. Although two members of the Board disagreed with Chairman Greenspan, Wall Street took the news badly and sold off toward new lows for the year. However, while the bears had a temporary victory, they are very close to losing the war. Several technical indicators point toward the bulls re-taking control of the market in the near future. This market is like a pot with the lid bolted on and the fire turned up underneath: eventually, that lid is going to break free. And, when it does, bond investors are going to feel the pain as they see their ``safe bonds'' blow up, too.

First and foremost, Money Flow into stocks was strongly bullish on Tuesday. The bulls aggressively were buying the dip. While this has been happening sporadically in days past, Tuesday's flows were stronger by far than previous days. And, this was true both in the S&P 500 and in the NASDAQ. Even the broad market, represented by the Value Line Index 15-Minute Chart, showed a rising trend in the Money Flow Line (which is why the bottom part of the price plot shows a solid green bar).

Secondly, the NASDAQ-100 Index (NDX) is leading the way higher — a very bullish indicator. Despite an initial bout of selling on the opening, NASDAQ recovered smartly and held its ground for most of the day — until the mutual funds came into the market in the last hour and sold to meet redemption orders. The opening minutes tend to see ``dumb money'' trading and they have been selling. The closing minutes see the public forcing mutual fund managers to sell some stocks in order to pay out cash and thus represent another segment of the ``dumb money equation.'' Some analysts consider the last hour of trading as ``smart money,'' but we don't think so. So, we have a couple of bookends of dumb money selling pressure sandwiched around the rest of the trading day. While a six-year low in NASDAQ was made Tuesday, the degree of intraday accumulation is a very positive development.

Both daily and intraday oscillators (such as stochastics, accumulation-distribution, etc.) are oversold, but diverging bullishly. This is a sign of a very solid bottom being put in place.

Volume is turning up in issues moving up in price. NASDAQ showed more volume in rising shares than declining ones on Tuesday. ``Bargains'' are being snapped up for the bull run to the end of the year.

Trendlines: support lines are very close underneath this market. As long as the market is able to hold those support lines, the upside potential is high relative to the downside risk.

Sentiment remains supportive as most OEX traders continue to bet more money on the downside than the upside. However, and this is a positive development, they are betting relatively less on the downside than at previous lows, thus constituting bullish divergence as the more savvy traders in the crowd start betting on the upside. Our Dollar-Weighted Call-Put Ratio on the OEX was 0.64 on Tuesday — it had been half that last week.

Some seasonal factors may continue to keep prices under pressure this week as the quarter ends. Earnings pre-announcements may appear, but should be diminishing after the last couple of weeks. Mutual fund managers may be selling losers so they don't have to show them on their end-of-quarter ``report card.'' These two factors are probably why the last week of September typically shows a downward trend. However, the market is deeply oversold and the bulls are showing they are not averse to buying bargains now. This is a market not unlike that of years past with stock prices compressed into a value range. Once the pressure is released, we will see an explosion to the upside, carrying the market much higher into the end of the year.

We bought back our short hedges Tuesday and are mostly long the market in various indices — and we're glad to be long and unhedged.

Format for printing. [Go back]

For Tuesday, September 24, 2002
© Bob Carver
$-Weighted OEX/QQQ Call/Put Ratios: 0.45/0.40
Popular Indices: http://www.marketclues.net/cgi-bin/myclues?chart=/:/indices/d/_spx.4903.html&member=@@ ^SPX · http://www.marketclues.net/cgi-bin/myclues?chart=/:/indices/d/_compq.4903.html&member=@@ ^IXQ · http://www.marketclues.net/cgi-bin/myclues?chart=/:/indices/d/_ndx.4903.html&member=@@ ^NDX · http://www.marketclues.net/cgi-bin/myclues?chart=/:/indices/d/_dj.4903.html&member=@@ ^DJI · http://www.marketclues.net/cgi-bin/myclues?chart=/:/indices/d/_mid.4903.html&member=@@ ^MID · http://www.marketclues.net/cgi-bin/myclues?chart=/:/indices/d/_oex.4903.html&member=@@ ^OEX · http://www.marketclues.net/cgi-bin/myclues?chart=/:/indices/d/_nya.4903.html&member=@@ ^NYA · http://www.marketclues.net/cgi-bin/myclues?chart=/:/indices/d/_vle.4903.html&member=@@ ^VLE · http://www.marketclues.net/cgi-bin/myclues?chart=/:/indices/d/_rut.4903.html&member=@@ ^RUT · http://www.marketclues.net/cgi-bin/myclues?chart=/:/indices/d/_sml.4903.html&member=@@ ^SML · http://www.marketclues.net/cgi-bin/myclues?chart=/:/futures/d/cr_a0.4903.html&member=@@ ^CRB · http://www.marketclues.net/cgi-bin/myclues?chart=/:/indices/d/_xau.4903.html&member=@@ ^XAU · http://www.marketclues.net/cgi-bin/myclues?chart=/:/indices/d/_btk.4903.html&member=@@ ^BTK · http://www.marketclues.net/cgi-bin/myclues?chart=/:/indices/d/_tyx.4903.html&member=@@ ^TYX
Sector Performance Since: 8 Apr 1999 · 18 Oct 1999 · A Week Ago · A Fortnight Ago
Sector Acceleration Since: 8 Apr 1999 · 18 Oct 1999 · A Week Ago · A Fortnight Ago

MyClues Home Page Link ("http://www.marketclues.net/cgi-bin/myclues?myhome=yes&member;[email protected]")

New article from Elliott Wave International (free registration for Club Elliott Wave is required):

Is the Worst Over?

In this excerpt from this month's Elliott Wave Theorist, Bob Prechter writes about the public's persistence and bullishness. Is their confidence justified or is it just irrational optimism? Read for yourself as Bob explains the technical indicators and wave counts for the current market. The media believes the worst is over, but we know it's not.

Stocks: Buyers Strike

The buyers were notably absent from the stock market Monday, preferring to wait for lower prices, or perhaps, more clarity in earnings as well as politics (the Emperor may have no clothes, but our German friends aren't supposed to say so). We still have another week of potential earnings warnings to get out of the way before third quarter earnings announcements begin.

The market did take interest rates down again, boosting bond prices. The 10-Year T-Note dropped into the 3.66% range — think of that: such a rate for inflation used to be considered a notable achievment for the Federal Reserve. Now that a majority of bond investors are so confident that we'll never see such ``high'' inflation rates again, you can expect rates are going much higher over the next ten years. Truly, the inflation ``premium'' in bond rates is gone.

Unfortunately, the Harris Poll released a report Monday that revealed the sordid truth behind the news: a majority of bond market investors, despite thinking that rates will rise in the future, don't realize rising rates mean falling bond prices! Clearly, we have another Bubble in the bond market we'll have to deal with in the future. Apparently, these are the same investors who took to heart the drivel about stocks always going up and that Long Term Buy and Hold was a ``Can't Lose'' investment strategy. After being driven to bonds by falling stock prices, these cattle have bid bond prices to the heavens. This has had the effect of generating a bubble in real estate as home owners refinance their mortgages (and take out second mortgages to finance their own inflated spending habits). Thus, we have the awful prospect going forward of two bubbles bursting: first, the bond market and second, the real estate market.

But, for now, we have stock prices which, if not exactly ``low'', are greatly oversold and ripe for a rally as soon as the buyers return. Technical indicators point toward excessive fear (our sentiment gauges are pegged in the overly-bearish category right now for both the OEX and the QQQ gauges), cycle lows due now and prices near very significant support levels. We're near fully invested in the stock market now (with some short term hedges in place which we intend to remove when the market confirms a bottom behind us).

Format for printing. [Go back]

For Monday, September 23, 2002
© Bob Carver
$-Weighted OEX/QQQ Call/Put Ratios: 0.40/0.33
Popular Indices: http://www.marketclues.net/cgi-bin/myclues?chart=/:/indices/d/_spx.4903.html&member=@@ ^SPX · http://www.marketclues.net/cgi-bin/myclues?chart=/:/indices/d/_compq.4903.html&member=@@ ^IXQ · http://www.marketclues.net/cgi-bin/myclues?chart=/:/indices/d/_ndx.4903.html&member=@@ ^NDX · http://www.marketclues.net/cgi-bin/myclues?chart=/:/indices/d/_dj.4903.html&member=@@ ^DJI · http://www.marketclues.net/cgi-bin/myclues?chart=/:/indices/d/_mid.4903.html&member=@@ ^MID · http://www.marketclues.net/cgi-bin/myclues?chart=/:/indices/d/_oex.4903.html&member=@@ ^OEX · http://www.marketclues.net/cgi-bin/myclues?chart=/:/indices/d/_nya.4903.html&member=@@ ^NYA · http://www.marketclues.net/cgi-bin/myclues?chart=/:/indices/d/_vle.4903.html&member=@@ ^VLE · http://www.marketclues.net/cgi-bin/myclues?chart=/:/indices/d/_rut.4903.html&member=@@ ^RUT · http://www.marketclues.net/cgi-bin/myclues?chart=/:/indices/d/_sml.4903.html&member=@@ ^SML · http://www.marketclues.net/cgi-bin/myclues?chart=/:/futures/d/cr_a0.4903.html&member=@@ ^CRB · http://www.marketclues.net/cgi-bin/myclues?chart=/:/indices/d/_xau.4903.html&member=@@ ^XAU · http://www.marketclues.net/cgi-bin/myclues?chart=/:/indices/d/_btk.4903.html&member=@@ ^BTK · http://www.marketclues.net/cgi-bin/myclues?chart=/:/indices/d/_tyx.4903.html&member=@@ ^TYX
Sector Performance Since: 8 Apr 1999 · 18 Oct 1999 · A Week Ago · A Fortnight Ago
Sector Acceleration Since: 8 Apr 1999 · 18 Oct 1999 · A Week Ago · A Fortnight Ago

MyClues Home Page Link ("http://www.marketclues.net/cgi-bin/myclues?myhome=yes&member;[email protected]")

Stocks: Bull Market Time Again

No, we're not wildly bullish, but we do recognize the signs of a bull market getting started in at least one sector of the market. That sector is the S&P 600 Small Cap Index (SML), which had only a 4-month bear market (as opposed to the almost 3-year bear market in the Dow Industrials, S&P 500 and NASDAQ indices) from its April top to its July 23rd closing low. The Weekly Chart shown below illustrates this index best. Although the entire structure subdivides into three-wave structures, the overall trend is higher. And, we've just finished a rare, and very bullish, expanding triangle (megaphone) pattern which should logically lead to much higher prices ahead.

Don't get us wrong: this is still a long-term bear market. If you go by the ``accepted'' definition of a bull market, any rise of 20% or more in an index constitutes a bull market. We came close on the July-August rally in the Small Caps: 18.63%. A rise to a new, all-time high in the index would constitute a rally of 45.67%.

As we said, it's still within the context of a long term bear market. We've gone over the technical reasons for that conclusion many times in the past, so we won't repeat that litany of problems facing this economy and this market (the archive has all of those reasons if you want to look back). Suffice it to say that even fundamentals point to much lower stock prices ahead. After the mania tops of the past, the S&P 500 Index typically bottoms at a PE ratio of 10 or less on a trailing decade basis (per Robert Schiller and Terry Laundry, see www.ttheory.com). Using those figures, one can quickly calculate that, without earnings growth going forward, the Dow Industrials would bottom below 3500. That means a better than 50% decline ahead in the Dow. But within that secular view, there are going to be bull markets as well as trends to the downside. The market cannot move back to fair value and into undervaluation without zigging and zagging its way lower. The bounces will sometimes be large enough for investors to wish they had participated if they had stayed in cash for the duration of the bear trend (one estimate by Elliott Wave International is that the secular bear market could last a century or more — you didn't think we'd stay out of stocks that long, now did you?).

After moving to the sidelines at the top and watching the carnage that ensued, we were ready to get back into the water last week as we recognized that risk was relatively low compared to potential rewards. One of the valid criticisms against market timing is that timers tend to miss the bottoms and re-enter the market after much of the upside potential has been realized. We, however, would rather get in near the bottom (whether that's early or not) when risk is relatively low, rather than missing the potential reward of a rally. That's why we suggested hedging — even if you're early, you can profit on the short term.

This next uptrend, which likely got started on Friday, or could get started early this week, is likely to carry the Small Caps to a new high. It also should see the headline NASDAQ-100, Dow Industrials and S&P 500 indices rise considerably to convince the bears that they should turn bullish and buy. It's after that shift in sentiment when we are likely to be turning bearish, for our time cycle based Omega Predictor is forecasting another dip into mid-November after a mid- to late-October rally top.

Time Ratios also point toward Friday the 20th of September as a key low, just as our Omega Predictor does. And, agreeing with time cycles, Time Ratios are also forecasting a low in mid-November for the stock market following this next rally.

Sentiment is a powerful indicator. And, it's saying fear is the predominant emotion right now. This last week, NASDAQ QQQ option players (QQQ tracks the NASDAQ-100 or NDX index) exhibited hugely bearish tendencies, unlike July when they were hog-wild bullish toward the market (and got their heads handed to them in that crash!). No doubt, the fear of September's poor seasonality has a lot to do with it. But, the fact remains, most traders and investors are very nervous and are either out of the market, buying puts or selling futures short right now due to the seasonal tendency for September to be a down month. Of course, they've been right this month so far, but now that we've seen the big decline, it's time for a rally.

The rally may start slowly: a move up here on short covering could be retraced into the end of September period. But, we think a move up here will be the start of the next leg up in the new bull market.

If you don't hedge your bets in the stock market, you will probably want to maintain a relatively high cash level into late October - mid November despite this rally. If you do hedge using the futures or options markets, you should maintain your current short hedges until the market rises enough to reach your stop loss order buy point, taking you out of your hedge. This hedging strategy allows you to protect your downside while partipating in most of the upside move. In many cases, such as last week, you will be able to make short term profits on the short hedge position while protecting your long term investments. Kind of like having your cake and eating it, too!

If, instead of indices, you're interested in buying strong individual stocks, check out our ranking of top stocks. With only about 7% of all stocks top-ranked (among the more than 3500 we track), your selection universe has been whittled down to a precious few. Any stock which ranks 10 in this kind of a brutal bear market has a much better chance of being profitable going forward. Of course, there are no guarantees.

Euro Currency: http://www.marketclues.net/cgi-bin/myclues?chart=/:/futures/d/ec_a0.4903.html&member=wcorney@keatepartners.com

The Euro continues to work through a trading range. Now, this could be a continuation pattern, but we doubt it. Commercial interests are overwhelmingly bearish on the Euro (25,467 long contracts are held by commercials who are bullish, but 61,514 short positions are held by the commercial bears on the Chicago Mercantile Exchange, a pretty lopsided margin of bears over bulls — and the commercial interests tend to be right in the long run).

U.S. Dollar Index: http://www.marketclues.net/cgi-bin/myclues?chart=/:/futures/d/dx_a0.4903.html&member=wcorney@keatepartners.com

With the commercials favoring the dollar, the Dollar Index continues to do well. With the US stock market about to rally, we can't see the Dollar Index doing anything substantial on the downside. It's still the world's favored reserve currency, despite the fact that it's in a long term bear market.

Canadian Dollar: http://www.marketclues.net/cgi-bin/myclues?chart=/:/futures/d/cd_a0.4903.html&member=wcorney@keatepartners.com

Bear trend continues despite the bounce last week. We expect the C$ to test the 62¢ range by mid-October.

S&P Toronto Stock Exchange http://www.marketclues.net/cgi-bin/myclues?chart=/:/indices/d/_sptse.4903.html&member=wcorney@keatepartners.com

The TSE is as deeply oversold as it was at the July low. And, since it should be tracking Wall Street, is likely to rally.

Australian Dollar: http://www.marketclues.net/cgi-bin/myclues?chart=/:/futures/d/ad_a0.4903.html&member=wcorney@keatepartners.com

Near term, a trading range (possibly an Elliott contracting triangle wave b) should be followed by a rally above 56¢ into mid-November. Since this appears to be a bear market rally, expect new lows after the next intermediate top.

Australian All Ordinaries: http://www.marketclues.net/cgi-bin/myclues?chart=/:/indices/d/_aord.4903.html&member=wcorney@keatepartners.com

The All-Ords rallied up to the old long term support line shown in yellow on the daily chart. With Wall Street in the dumps, the Australian market fell in sympathy. It stands to reason, though, that with Wall Street poised to move higher, the Aussie market should follow to overcome that old support line which now poses severe resistance. The only fly in this ointment is that the Australian market made a lower low in August than July, which is why the Time Ratio Low shown on the chart is for the end of September rather than the 20th. It appears that we could get a bounce now, with a retest at the end of the month (same for Wall Street, in fact).
Australia Business News http://www.abc.net.au/news/business/default.htm
Yahoo! Australia Business News http://au.dailynews.yahoo.com/Full_Coverage/Australian_Economy/

London Financial-Times 100: http://www.marketclues.net/cgi-bin/myclues?chart=/:/indices/d/_ftse.4903.html&member=wcorney@keatepartners.com

London fell right into the full moon timing for a low due Saturday. We expect this will mark the end of the retest of the July low and lead directly into a bull market rally.

Bonds / Interest Rates:

Bubble of the Month Club: bonds are a bubbling mania as billions upon billions of dollars pour into 10-year US Treasury obligations yielding only about 3.8%. Obviously, these manic investors are more interested in the 100% return of their capital and couldn't care less whether they actually turn a profit after inflation and taxes. Just like the stock market mania (Bubble) of the 'Nineties, the Bond Bubble of the 'Naughties will end up as another painful investment memory for millions of investors in the future.

Target 2030 Zero Coupon Bond Fund Quote

Sectors and Individual Stocks (Subscribers Only)

For tables ranking sectors and individual stocks, and links to charts of 3500 individual stocks and sectors, please visit your very own MyClues Home Page[http://www.marketclues.net/cgi-bin/myclues?myhome=yes&member=@@] -- in the CHARTS & RESEARCH section of the page, you will find a wealth of tools for selecting top sectors and stocks, including access to our exclusive realtime, intraday indicators.

For a 3-4 month free trial subscription, click here.

Commodities (Subscribers Only)

For complete charts of commodities, please visit your very own MyClues Home Page[http://www.marketclues.net/cgi-bin/myclues?myhome=yes&member=@@] -- in the CHARTS & RESEARCH section of the page, you will find links to webpages containing links to the following:

For a 3-4 month free trial subscription, click here.

CRB Index: http://www.marketclues.net/cgi-bin/myclues?chart=/:/futures/d/cr_a0.4903.html&member=wcorney@keatepartners.com

Five waves up means the short term rally is pretty much over, but it isn't the end of the bull market in commodities. In fact, this bull market has considerably farther to go. The End of Deflation is something every investor should celebrate, but the bond market is going to get hit hard from rising inflation worries.

Gold Stocks: http://www.marketclues.net/cgi-bin/myclues?chart=/:/indices/d/_xau.4903.html&member=wcorney@keatepartners.com

While overall commodity prices are rising, Gold is in a very precarious position here and appears on the verge of a crash.

Format for printing. [Go back]

For Friday, September 20, 2002
© Bob Carver
$-Weighted OEX/QQQ Call/Put Ratios: 0.28/0.29
Popular Indices: http://clues.dhs.org:777/cgi-bin/myclues?chart=/:/indices/d/_spx.4903.html&member=@@ ^SPX · http://clues.dhs.org:777/cgi-bin/myclues?chart=/:/indices/d/_compq.4903.html&member=@@ ^IXQ · http://clues.dhs.org:777/cgi-bin/myclues?chart=/:/indices/d/_ndx.4903.html&member=@@ ^NDX · http://clues.dhs.org:777/cgi-bin/myclues?chart=/:/indices/d/_dj.4903.html&member=@@ ^DJI · http://clues.dhs.org:777/cgi-bin/myclues?chart=/:/indices/d/_mid.4903.html&member=@@ ^MID · http://clues.dhs.org:777/cgi-bin/myclues?chart=/:/indices/d/_oex.4903.html&member=@@ ^OEX · http://clues.dhs.org:777/cgi-bin/myclues?chart=/:/indices/d/_nya.4903.html&member=@@ ^NYA · http://clues.dhs.org:777/cgi-bin/myclues?chart=/:/indices/d/_vle.4903.html&member=@@ ^VLE · http://clues.dhs.org:777/cgi-bin/myclues?chart=/:/indices/d/_rut.4903.html&member=@@ ^RUT · http://clues.dhs.org:777/cgi-bin/myclues?chart=/:/indices/d/_sml.4903.html&member=@@ ^SML · http://clues.dhs.org:777/cgi-bin/myclues?chart=/:/futures/d/cr_a0.4903.html&member=@@ ^CRB · http://clues.dhs.org:777/cgi-bin/myclues?chart=/:/indices/d/_xau.4903.html&member=@@ ^XAU · http://clues.dhs.org:777/cgi-bin/myclues?chart=/:/indices/d/_btk.4903.html&member=@@ ^BTK · http://clues.dhs.org:777/cgi-bin/myclues?chart=/:/indices/d/_tyx.4903.html&member=@@ ^TYX
Sector Performance Since: 8 Apr 1999 · 18 Oct 1999 · A Week Ago · A Fortnight Ago
Sector Acceleration Since: 8 Apr 1999 · 18 Oct 1999 · A Week Ago · A Fortnight Ago

MyClues Home Page Link ("http://clues.dhs.org:777/cgi-bin/myclues?myhome=yes&member;[email protected]")

Special Note: our Internet Service Provider (ISP) is involved in a lawsuit with their ex-DSL partner. Consequently, we have switched the website to our alternate internet route, clues.dhs.org:777, until the legal matters are resolved.

Stocks: Panic Continues On Wall Street

The loonies ruled the day Thursday, but hedges paid off for investors.

We bought back into the market early because overall long term risk is very low right now, not because we didn't think there was any downside risk, but because we are in the right timeframe for a cycle low. Then, we suggested in our update Tuesday evening and on our Trading Page Wednesday buying puts or short selling futures to hedge against the short term downside risk. We gave a specific time at which those hedges could be put in place — and that place turned out to have been very near top tick on Wednesday. So far, that has been quite a profitable short term strategy: those who did so are ahead 265 Dow points, or $2650 per contract, if they chose to short sell the December Dow futures at the time we issued the specific hedging suggestion Wednesday afternoon. The beauty of this strategy is that you don't have to pay close attention to the market to buy the exact bottom (you already are into your bullish position), yet you are protected by your hedges in case of a crash. The only thing you have to do now is to make sure you remove your hedges — i.e., collect your profits — after the market starts to rally out of the hole.

In any case, the market is clearly in the vicinity of a bottom, time-wise. It may not be the final bottom in the long term bear market, but it certainly should setup an excellent rally. The NASDAQ-100 Index, our lead-dog that tends to bottom ahead of the rest of the market, is showing extremely good strength relative to the blue chips and refused to break below its recent short term support line Thursday. At the same time, the Dow Industrials did break support at 8000, leading to the triggering of large numbers of sell stop orders in the minutes just before the close Thursday. It does appear that the NASDAQ is leading at the bottom.

The sentiment numbers continue to point toward a low in this timeframe. On Thursday, QQQ traders were bearish, preferring puts over calls by a wide margin. Contrast this behavior with those same traders at the July and August lows: they overwhelmingly bought calls over puts at that time. This is a real sea change from that crowd. The OEX crowd has been consistently bearish for months, so there wasn't much change there.

Since the chances are that we are just about to reverse trend and rally, if you do hold those short term hedges, you should make sure you move your exit stop orders down close to the market so that when the market does rally substantially, you will be taken out of your position with excellent hedging profits. If you bought puts, you exit by selling; if you sold futures short, your exit order is a buy stop order. Monitor the Trading Page on Friday for intraday suggestions on this point, but you need to make sure you have those exit orders in with your brokers. You wouldn't want to be caught short when the market turns up!

Friday is the day of the ideal cycle low. It is also a Time Ratio Low day, Triple-Witching options and futures expiration, and the day before a Full Moon. The latter, of course, explains the close correlation between Wall Street and Looney Tunes this week.

Format for printing. [Go back]

For Thursday, September 19, 2002
© Bob Carver
$-Weighted OEX/QQQ Call/Put Ratios: 0.32/0.14
Popular Indices: http://clues.dhs.org:777/cgi-bin/myclues?chart=/:/indices/d/_spx.4903.html&member=@@ ^SPX · http://clues.dhs.org:777/cgi-bin/myclues?chart=/:/indices/d/_compq.4903.html&member=@@ ^IXQ · http://clues.dhs.org:777/cgi-bin/myclues?chart=/:/indices/d/_ndx.4903.html&member=@@ ^NDX · http://clues.dhs.org:777/cgi-bin/myclues?chart=/:/indices/d/_dj.4903.html&member=@@ ^DJI · http://clues.dhs.org:777/cgi-bin/myclues?chart=/:/indices/d/_mid.4903.html&member=@@ ^MID · http://clues.dhs.org:777/cgi-bin/myclues?chart=/:/indices/d/_oex.4903.html&member=@@ ^OEX · http://clues.dhs.org:777/cgi-bin/myclues?chart=/:/indices/d/_nya.4903.html&member=@@ ^NYA · http://clues.dhs.org:777/cgi-bin/myclues?chart=/:/indices/d/_vle.4903.html&member=@@ ^VLE · http://clues.dhs.org:777/cgi-bin/myclues?chart=/:/indices/d/_rut.4903.html&member=@@ ^RUT · http://clues.dhs.org:777/cgi-bin/myclues?chart=/:/indices/d/_sml.4903.html&member=@@ ^SML · http://clues.dhs.org:777/cgi-bin/myclues?chart=/:/futures/d/cr_a0.4903.html&member=@@ ^CRB · http://clues.dhs.org:777/cgi-bin/myclues?chart=/:/indices/d/_xau.4903.html&member=@@ ^XAU · http://clues.dhs.org:777/cgi-bin/myclues?chart=/:/indices/d/_btk.4903.html&member=@@ ^BTK · http://clues.dhs.org:777/cgi-bin/myclues?chart=/:/indices/d/_tyx.4903.html&member=@@ ^TYX
Sector Performance Since: 8 Apr 1999 · 18 Oct 1999 · A Week Ago · A Fortnight Ago
Sector Acceleration Since: 8 Apr 1999 · 18 Oct 1999 · A Week Ago · A Fortnight Ago

MyClues Home Page Link ("http://clues.dhs.org:777/cgi-bin/myclues?myhome=yes&member;[email protected]")

Special Note: our Internet Service Provider (ISP) is involved in a lawsuit with their ex-DSL partner. Consequently, we have switched the website to our alternate internet route, clues.dhs.org:777, until the legal matters are resolved.

Stocks: Panic Grips NASDAQ

Sentiment shifted completely to the bearish case on Wednesday as those QQQ option traders who had recently been wildly bullish swung over completely to the bear case and bought huge numbers of puts. Since this group had been consistently bullish during the 80% correction in the NASDAQ, we think this is a very significant sea change for the market. It may not be a confirmation of a bottom in place yet, but it is a very bullish indicator for a turn to the upside that's warming up in the wings.

OEX traders were bearish, too, but more reserved in their bearishness. They, however, have been bearish for months and may have lost some of their value as contrary indicators.

The market sold off from the get-go, but turned up on an intraday Time Ratio Low. Talk on the NYSE was that an asset allocator had a switch from bonds to stocks trigger when the 10-year Treasury Note hit 3.81%. Asset allocators try to keep a balance between stocks and bonds. When the bond market rallies, their mechanical system tells them to sell some bonds and buy stocks, so the infusion of cash helped the market rally back. End of day selling, though, forced the market lower into the close.

We have more Time Ratio Lows due intraday on Thursday which should come into play. We're also working toward a time cycle low due this week. And, a full moon is due on Saturday, which could provide another impetus for a trend change. Don't scoff: the July 24th low, as well as the August 22nd high, coincided exactly with full moons. Add to that the Triple-Witching expiration this Friday and you have the ingredients for a very volatile market.

We read an interesting stock market seasonality study by George Dagnino on his website at PeterDag.com. The bottom line to the study was that downside risk in similar market years as 2002 between September and December seems to be limited to 5% with upside potential around 15%. Thus, it pays to be aggressively long (on an investment basis, of course) in September.

Other notable points:

Format for printing. [Go back]

For Wednesday, September 18, 2002
© Bob Carver
$-Weighted OEX/QQQ Call/Put Ratios: 0.36/0.67
Popular Indices: http://clues.dhs.org:777/cgi-bin/myclues?chart=/:/indices/d/_spx.4903.html&member=@@ ^SPX · http://clues.dhs.org:777/cgi-bin/myclues?chart=/:/indices/d/_compq.4903.html&member=@@ ^IXQ · http://clues.dhs.org:777/cgi-bin/myclues?chart=/:/indices/d/_ndx.4903.html&member=@@ ^NDX · http://clues.dhs.org:777/cgi-bin/myclues?chart=/:/indices/d/_dj.4903.html&member=@@ ^DJI · http://clues.dhs.org:777/cgi-bin/myclues?chart=/:/indices/d/_mid.4903.html&member=@@ ^MID · http://clues.dhs.org:777/cgi-bin/myclues?chart=/:/indices/d/_oex.4903.html&member=@@ ^OEX · http://clues.dhs.org:777/cgi-bin/myclues?chart=/:/indices/d/_nya.4903.html&member=@@ ^NYA · http://clues.dhs.org:777/cgi-bin/myclues?chart=/:/indices/d/_vle.4903.html&member=@@ ^VLE · http://clues.dhs.org:777/cgi-bin/myclues?chart=/:/indices/d/_rut.4903.html&member=@@ ^RUT · http://clues.dhs.org:777/cgi-bin/myclues?chart=/:/indices/d/_sml.4903.html&member=@@ ^SML · http://clues.dhs.org:777/cgi-bin/myclues?chart=/:/futures/d/cr_a0.4903.html&member=@@ ^CRB · http://clues.dhs.org:777/cgi-bin/myclues?chart=/:/indices/d/_xau.4903.html&member=@@ ^XAU · http://clues.dhs.org:777/cgi-bin/myclues?chart=/:/indices/d/_btk.4903.html&member=@@ ^BTK · http://clues.dhs.org:777/cgi-bin/myclues?chart=/:/indices/d/_tyx.4903.html&member=@@ ^TYX
Sector Performance Since: 8 Apr 1999 · 18 Oct 1999 · A Week Ago · A Fortnight Ago
Sector Acceleration Since: 8 Apr 1999 · 18 Oct 1999 · A Week Ago · A Fortnight Ago

MyClues Home Page Link ("http://clues.dhs.org:777/cgi-bin/myclues?myhome=yes&member;[email protected]")

Special Note: our Internet Service Provider (ISP) is involved in a lawsuit with their ex-DSL partner. Consequently, we have switched the website to our alternate internet route, clues.dhs.org:777, until the legal matters are resolved.

New article from Elliott Wave International (free registration for Club Elliott Wave is required):

Is the Worst Over?

In this excerpt from this month's Elliott Wave Theorist, Bob Prechter writes about the public's persistence and bullishness. Is their confidence justified or is it just irrational optimism? Read for yourself as Bob explains the technical indicators and wave counts for the current market. The media believes the worst is over, but we know it's not.

Stocks: Early Gap Higher Quickly Reversed

The market gapped open much higher on news that Saddam Hussein had promised to unfettered weapons inspections in Iraq. The buyers were probably mostly short sellers who were covering their positions. The rally didn't last and quickly saw all gains reversed. It was strange to see the big price gains on such a premise as Saddam Hussein, known liar and megalomaniac, actually conceding defeat this early in the game. There are a lot more twists and turns ahead in this deadly cat and mouse game. Most likely, this gambit is just a tactic to forestall the commencement of hostilities. For what purpose? We can only speculate that Iraq may be close, but not quite there yet to developing something of military significance in a future conflict.

Despite the fakeout rally, there are ingredients for an intermediate term rally developing:

  1. Relative strength in the NASDAQ-100, an index which tends to lead the rest of the market at key turns, continued throughout the afternoon, as it has in recent days. This strength in the high-tech sector (SOX was relatively strong as well) could be a sign that a turn in this very depressed sector is in the works. If our pattern call on the NASDAQ-100 is correct (a contracting triangle just finishing its B-wave decline), a rally should carry that index higher. It would be very unusual if NDX could rally without participation by the rest of the market.

  2. Small cap stocks are outperforming the big blue chips, which suggests that the underlying broader market is healthier than the headline indices.

  3. Sentiment is now consistently in the overly-bearish category, even in the formerly overly-bullish QQQ options. The crowd is always wrong at turns (but can be right in the middle of a move). We are more comfortable going against the crowd. The OEX ratio showed only 36¢ being bet on a rally for each dollar bet on decline. The QQQ ratio showed 67¢ bet on a rally for each dollar bet on a decline.

  4. Cycle and Time Ratio Lows are due this week which could provide launch pads for a rally. The broader market TR Lows are due before the blue chips (Tuesday and Wednesday vs. Thursday and Friday for the blue chips).

  5. Downside volume is at near-capitulation levels (85% downside volume on the NYSE).

  6. The S&P 500 Index is near significant support levels.

  7. Option expiration this week is likely to see price manipulation to the upside. Maximum Pain Theory says the OEX needs to close at 455 on Friday to inflict maximum pain on OEX traders (it closed Tuesday at 438.55) and the QQQ needs to close at 24 to inflict maximum pain on NDX traders (it closed Tuesday at 22.34). Given enough upside momentum from option/stock manipulation, short covering in the futures market could continue to add to the upward pressure on the stock indices. And, we're near the end of the quarter; a rally into month-end would put additional pressure on portfolio managers to buy.

  8. We are in the timeframe for a bottom in the London market, which tends to lead the US market.

  9. The bond market reached resistance near the close. Profit-taking in bonds could send money flowing back into equities as asset allocators adjust their weightings of asset classes to reduce bonds and increase equities.

We moved back into the market on a longer-term investment basis on the afternoon dip as announced on our Trading Page and via email to our Notification List (see your MyClues Home Page to add or remove your email address from this list — the links are on the Special Reports header). Here are the asset allocations in our investment accounts as of the close Tuesday:

SPY - S&P 500 Spyders (18.2%)
DIA - Dow Jones Industrials (16.9%)
QQQ - NASDAQ 100 (13.5%)
IJR - S&P 600 Small Caps (27%)
EWA - Australia IShares (18.2%)
(Percentages may not add to 100% due to rounding.)

We retain a 6.1% cash position. If the market shows unexpected weakness in the days to come, we may add hedges in our trading accounts to offset potential losses from our investment long position.

Format for printing. [Go back]

For Tuesday, September 17, 2002
© Bob Carver
$-Weighted OEX/QQQ Call/Put Ratios: 0.58/0.67
Popular Indices: http://clues.dhs.org:777/cgi-bin/myclues?chart=/:/indices/d/_spx.4903.html&member=@@ ^SPX · http://clues.dhs.org:777/cgi-bin/myclues?chart=/:/indices/d/_compq.4903.html&member=@@ ^IXQ · http://clues.dhs.org:777/cgi-bin/myclues?chart=/:/indices/d/_ndx.4903.html&member=@@ ^NDX · http://clues.dhs.org:777/cgi-bin/myclues?chart=/:/indices/d/_dj.4903.html&member=@@ ^DJI · http://clues.dhs.org:777/cgi-bin/myclues?chart=/:/indices/d/_mid.4903.html&member=@@ ^MID · http://clues.dhs.org:777/cgi-bin/myclues?chart=/:/indices/d/_oex.4903.html&member=@@ ^OEX · http://clues.dhs.org:777/cgi-bin/myclues?chart=/:/indices/d/_nya.4903.html&member=@@ ^NYA · http://clues.dhs.org:777/cgi-bin/myclues?chart=/:/indices/d/_vle.4903.html&member=@@ ^VLE · http://clues.dhs.org:777/cgi-bin/myclues?chart=/:/indices/d/_rut.4903.html&member=@@ ^RUT · http://clues.dhs.org:777/cgi-bin/myclues?chart=/:/indices/d/_sml.4903.html&member=@@ ^SML · http://clues.dhs.org:777/cgi-bin/myclues?chart=/:/futures/d/cr_a0.4903.html&member=@@ ^CRB · http://clues.dhs.org:777/cgi-bin/myclues?chart=/:/indices/d/_xau.4903.html&member=@@ ^XAU · http://clues.dhs.org:777/cgi-bin/myclues?chart=/:/indices/d/_btk.4903.html&member=@@ ^BTK · http://clues.dhs.org:777/cgi-bin/myclues?chart=/:/indices/d/_tyx.4903.html&member=@@ ^TYX
Sector Performance Since: 8 Apr 1999 · 18 Oct 1999 · A Week Ago · A Fortnight Ago
Sector Acceleration Since: 8 Apr 1999 · 18 Oct 1999 · A Week Ago · A Fortnight Ago

MyClues Home Page Link ("http://clues.dhs.org:777/cgi-bin/myclues?myhome=yes&member;[email protected]")

Special Note: our Internet Service Provider (ISP) is involved in a lawsuit with their ex-DSL partner. Consequently, we have switched the website to our alternate internet route, clues.dhs.org:777, until the legal matters are resolved.

The case for $1450/oz gold: Mountain of Unregulated Derivatives is De Facto Financial Terrorism by Harry Schultz & James Sinclair (Financial Sense website). ``All the gold above ground presently is 860,000,000 [ounces] ... [Derivative dealers who have sold short gold must eventually purchase] a total of 900,000,000 ounces of gold ... all derivative dealers in gold will be bankrupt.''

Stocks: Light Day

The market waffled and wavered, but ultimately ended little changed in light holiday trading Monday. The blue chip Dow and S&P 500 benefitted slightly from profit-taking in bonds toward the close of trading, but both the NYSE and NASDAQ registered a preponderance of losers.

We are looking for the market to have an upward bias this week as options expire on Friday. This week will also feature Triple-Witching Expiration as September futures, options on individual stocks and options on stock indices all expire simultaneously. Since a preponderance of puts have been sold to investors to hedge portfolios and to speculate on the bear trend, those puts will need to be expired out-of-the-money by option market manipulators (if possible). Maximum pain theory values for OEX players occurs at the 455 strike price (the OEX closed at 446.65). And, for QQQ players, maximum pain is at 24 (QQQ closed at 22.67). Thus, a rise in both indices is more likely than a fall this week.

Option activity saw more dollars going into puts than calls on Monday. The OEX players remain very bearish with a call-put ratio of 0.58. And, the QQQ players have shown some bearishness for a second straight trading day with a call-put ratio of 0.67. These are very constructive sentiment figures for the short term, indicating as they do a pessimistic attitude among a group of people who are known to be wrong as a group.

The real key for stocks is for a correction in the bond market to force some of that cash into the stock market. On Monday, bonds were strong all day. However, bonds are overbought and ripe for a correction, so Tuesday and Wednesday are likely to be up days in the stock market.

Format for printing. [Go back]

For Monday, September 16, 2002
© Bob Carver
$-Weighted OEX/QQQ Call/Put Ratios: 0.47/0.66
Popular Indices: http://clues.dhs.org:777/cgi-bin/myclues?chart=/:/indices/d/_spx.4903.html&member=@@ ^SPX · http://clues.dhs.org:777/cgi-bin/myclues?chart=/:/indices/d/_compq.4903.html&member=@@ ^IXQ · http://clues.dhs.org:777/cgi-bin/myclues?chart=/:/indices/d/_ndx.4903.html&member=@@ ^NDX · http://clues.dhs.org:777/cgi-bin/myclues?chart=/:/indices/d/_dj.4903.html&member=@@ ^DJI · http://clues.dhs.org:777/cgi-bin/myclues?chart=/:/indices/d/_mid.4903.html&member=@@ ^MID · http://clues.dhs.org:777/cgi-bin/myclues?chart=/:/indices/d/_oex.4903.html&member=@@ ^OEX · http://clues.dhs.org:777/cgi-bin/myclues?chart=/:/indices/d/_nya.4903.html&member=@@ ^NYA · http://clues.dhs.org:777/cgi-bin/myclues?chart=/:/indices/d/_vle.4903.html&member=@@ ^VLE · http://clues.dhs.org:777/cgi-bin/myclues?chart=/:/indices/d/_rut.4903.html&member=@@ ^RUT · http://clues.dhs.org:777/cgi-bin/myclues?chart=/:/indices/d/_sml.4903.html&member=@@ ^SML · http://clues.dhs.org:777/cgi-bin/myclues?chart=/:/futures/d/cr_a0.4903.html&member=@@ ^CRB · http://clues.dhs.org:777/cgi-bin/myclues?chart=/:/indices/d/_xau.4903.html&member=@@ ^XAU · http://clues.dhs.org:777/cgi-bin/myclues?chart=/:/indices/d/_btk.4903.html&member=@@ ^BTK · http://clues.dhs.org:777/cgi-bin/myclues?chart=/:/indices/d/_tyx.4903.html&member=@@ ^TYX
Sector Performance Since: 8 Apr 1999 · 18 Oct 1999 · A Week Ago · A Fortnight Ago
Sector Acceleration Since: 8 Apr 1999 · 18 Oct 1999 · A Week Ago · A Fortnight Ago

MyClues Home Page Link ("http://clues.dhs.org:777/cgi-bin/myclues?myhome=yes&member;[email protected]")

Special Note: our Internet Service Provider (ISP) is involved in a lawsuit with their ex-DSL partner. Consequently, we have switched the website to our alternate internet route, clues.dhs.org:777, until the legal matters are resolved.

New article from Elliott Wave International (free registration for Club Elliott Wave is required):

Is the Worst Over?

In this excerpt from this month's Elliott Wave Theorist, Bob Prechter writes about the public's persistence and bullishness. Is their confidence justified or is it just irrational optimism? Read for yourself as Bob explains the technical indicators and wave counts for the current market. The media believes the worst is over, but we know it's not.

Stocks: Guideposts and Roadmaps

Knowing the Difference is Important

Investing/trading is like a lifetime journey in a strange land without a reliable map. Guideposts are available, but seldom reliable. Many investors search incessantly for the map that will lead them to the pot o' gold, while others blindly buy and hold, hoping the passage of time will allow them to reach a successful destination. Still others search for gurus who they think may hold secrets hidden from the many.

There are no maps and few hidden secrets to investing. As Market Wizards and its sequels by Jack Schwager prove, there are many paths to riches, but many more to ruin. The key to success is to stop looking for maps. A map implies that a forecast of the future can be made which is accurate. No such instrument exists, as chaos theory proves. If a map is to be followed, it is certain that it will diverge from reality at some unknown point in the future, leaving the weary traveler destitute if followed blindly.

What does exist are guideposts to the future. They point the way, for now, to where the market is likely to move. These guideposts are not always reliable and, in fact, there are probably far more unreliable guideposts than reliable ones. Distinguishing the difference is paramount. The traveler must always remain alert for the next set of guideposts in the journey, weigh their significance and reject those which are ephemeral and follow those which make sense.

Thus, since the top in the Bubble bull market of 2000, we have searched for new guideposts along the way down. We followed reliable guideposts going into the top which told us that the path forked there. They warned that the extreme overvaluation of the blue chip indices, especially the NASDAQ, was at a turning point, a mountain peak, and that the path ahead had a steep slope going down the mountainside.

Thus, we sold our stock market holdings (and, for more aggressive investors, bought bear mutual funds for the initial slide) and moved into cash right on the day of the top. Watching the journey of the market as it slid heavily down the mountain was easy to do from the safety of cash.

But, soon, we realized that only a portion of the market — the most visible and overblown headline stocks — were actually crumbling in the landslide. The small cap and mid cap stock sectors were not only holding up in the onslaught of selling, they were actually moving back to new highs as the dust cleared from the last slide. New guideposts served us well as we reinvested that sideline cash in the Small Cap (SML) and Mid Cap (MID) indices. We had found not only shelter from the storm, but investments which would actually produce profits.

During the middle of 2001, though, the storm clouds of war were gathering, although we didn't fully realize it until September 11th. What had been strong became weak and the market tumbled. However, the market rebounded well and our strong sectors once again moved to new highs in April 2002. By the May highs, which tested the all-time highs made just one month prior, our reliable guideposts were now pointing down. Once again, we moved to sideline our investment cash as the market — this time the entire market — rolled over the top of the mountain and headed down with accelerating momentum.

Since then, as investors we have remained mostly in cash as the strongest part of the bear market crushed stocks. By July, the average stock was down 50%, the NASDAQ down 80%, from their highs. Our guideposts started suggesting that intense downward momentum had carried the market ``too far, too fast'' in July and that a rebound, possibly to the top of the downtrend channel in the NASDAQ-100 (NDX) could take place. We re-entered the market briefly, but found new signs that the rally was destined to fail due to its inherent bear market bias. Since then, our caution has been proven correct in that the rally did fail and stocks have fallen substantially lower. The NASDAQ-100, in fact, retraced over 86% of its initial spurt higher in August, forming a low on September 5th. The senior blue chips (Dow Industrials Average and S&P 500 Index) retraced about half of their 5-week bear market rallies before finding support and rallying in the patriotic 911 bounce we were looking for this last week. That the market rallied right into Wednesday the 11th and then sold off sharply into week's end wasn't a surprise: manipulation moves the stock market far more often than most investors will ever admit. Note that the September S&P 500 futures contract closed exactly on 911.00 the day before the anniversary of the 911 attack.

One of the guideposts we look for is Elliott Waves, which are often ambiguous in that they offer up a plethora of possibilities (some of which we laid out in the prior update). But, there are times when this guidepost points squarely to a high-probability pattern. We think this guidepost is doing just that right now, at least for one of the most important sectors in this market: the NASDAQ-100.

The chart above ("http://clues.dhs.org:777/img/ndx20020913.gif") shows how NDX may very well be tracing out a time-wasting contracting triangle formation. This is a ``reasonable'' pattern for the index to be following for a number of reasons, including these two:

  1. The steep downward dive (``crash'') from March to August in NDX created sufficient excess momentum (a sort of ``kinetic energy'' — energy of motion) that a time-wasting pattern is necessary to let the market ``catch up'' with the fundamentals. Certainly, we haven't seen business fall off a cliff from March to August, so the market was simply doing what it does best: adjusting expectations. And expectations are for more of the same: depressed activity in the leading stocks of the 21st Century. The contracting triangle, a gradually narrowing trading range within which movements are almost random on a day-to-day basis, works to allow the market to adjust to the new business reality.

  2. Market participants are uncertain of what is going to happen. This mental uncertainty is reflected in schizoid movements within a pattern which is going nowhere. Fears of war, further accounting scandals, and further declines in business are balanced by hopes of peace, hopes of honesty in corporate governance and hopes of recovery in business (with concomittant creation of new jobs in the future), resulting in a market price pattern which sees no reason to move above or below its median line.

The patterns in the other indices are only slightly different from NDX. What may be a horizontal trading range in NDX may be seen to be an uptilted ``wedge'' in others, or a downtitled wedge in still others. But, we chose this index, NDX, both for the clarity of its pattern (strong trends bring out the Elliott Wave patterns) and for the leading nature of the index itself — we believe the whole stock market will suffer through a bear market as long as NDX is in a bear market. In fact, we believe NDX itself will lead the whole market, bottoming earliest of all and entering its next bull market ahead of the pack.

Sentiment is beginning to reflect bottoming levels in the stock market. The OEX traders have been bearish for some time now, but the QQQ traders (the QQQ tracks NDX) have been quite bullish. Finally, that bullishness seems to be breaking down as the ratio came in at 0.66 on Friday (indicating that for every dollar paid for puts, only 66¢ were paid for calls, showing that the crowd was putting its money where its sentiment was: bets on further downside price movement). Thus, bearish sentiment is supportive for a short term rally.

Maximum Pain Theory tells us that a close for OEX at 455 on Friday would produce the maximum amount of pain for investors, while that value for the QQQ is 24. The OEX closed Friday at 444.24 and the QQQ at 22.99, so that theory is in agreement with the raw sentiment figures.

Bottom Line: The market is likely to remain within a trading range pattern. We caution that the projected path of the market above is by no means a map of future market action. Instead, treat it as a (possibly unreliable) guidepost. Near term, we should see the market rally in wave C as in the chart. Investors should preserve cash, while traders may find daytrade opportunities less risky than holding positions overnight. An unusual number of short term turns have been occuring in the overnight sessions, which are difficult to manage. As the narrowing trading range continues to its inevitable conclusion risks should also decline. However, since we're counting this as a contracting triangle, a thrust decline to the bear market low should provide the final opportunity for bear profits and the beginning of a bull market rise, all within the context of an ongoing long term bear market which may see a final low in April-June of 2003.

Euro Currency: http://clues.dhs.org:777/cgi-bin/myclues?chart=/:/futures/d/ec_a0.4903.html&member=wcorney@keatepartners.com

The Euro is working through a correction which is taking the form of a trading range, so the downside is limited. Should continue to be rangebound for the immediate future.

U.S. Dollar Index: http://clues.dhs.org:777/cgi-bin/myclues?chart=/:/futures/d/dx_a0.4903.html&member=wcorney@keatepartners.com

Turn the Euro upside down and what do you get? The US Dollar Index. Another trading range. The difference is that this is a trading range in a bear market. It's likely that the final plunge in the US stock market will coincide with the next leg down in the Dollar Index, so it could take a while.

Canadian Dollar: http://clues.dhs.org:777/cgi-bin/myclues?chart=/:/futures/d/cd_a0.4903.html&member=wcorney@keatepartners.com

The C$ remains in a bearish trend against the US$.

S&P Toronto Stock Exchange http://clues.dhs.org:777/cgi-bin/myclues?chart=/:/indices/d/_sptse.4903.html&member=wcorney@keatepartners.com

The Canadian market is following Wall Street and matching its moves almost tick for tick. One difference with the Toronto Stock Exchange Index, however, is that it gave back less (as a retracement) of the July-August gains. Otherwise, the pattern is very similar.

On the longer term, the market is very close to its median price between the two support and resistance lines shown on the daily chart. Since a bottom in the bear market is not expected for another year, risk and reward are slightly tilted to the bear case (price values of the two trendlines are shown on the daily chart page for reference).

Australian Dollar: http://clues.dhs.org:777/cgi-bin/myclues?chart=/:/futures/d/ad_a0.4903.html&member=wcorney@keatepartners.com

Stable exchange rates here as the A$ works through its own trading range.

Australian All Ordinaries: http://clues.dhs.org:777/cgi-bin/myclues?chart=/:/indices/d/_aord.4903.html&member=wcorney@keatepartners.com

The market rallied last week, but dipped toward the end on Wall Street weakness. We'll hazard a guess that the market is going to ``orbit'' above and below its old support line (shown in yellow on the daily chart linked above) for some time to come. This implies the old upward trend may still allow long term holders to benefit from the rise, plus provide traders some opportunity to buy the dips and sell the rallies.
Australia Business News http://www.abc.net.au/news/business/default.htm
Yahoo! Australia Business News http://au.dailynews.yahoo.com/Full_Coverage/Australian_Economy/

London Financial-Times 100: http://clues.dhs.org:777/cgi-bin/myclues?chart=/:/indices/d/_ftse.4903.html&member=wcorney@keatepartners.com

The market dipped right into the end-of-week leadin to the Time Ratio Low due today. Since we expect Wall Street will have another rally (wave C in the NDX chart above), we would expect London to participate.

Bonds / Interest Rates:

The rate charts show that we should be bottoming in rates, topping in price, right now. This is a factor which says that money will soon be flowing out of bonds and (some) ending up in the stock market.

Target 2030 Zero Coupon Bond Fund Quote

Sectors and Individual Stocks (Subscribers Only)

For tables ranking sectors and individual stocks, and links to charts of 3500 individual stocks and sectors, please visit your very own MyClues Home Page[http://clues.dhs.org:777/cgi-bin/myclues?myhome=yes&member=@@] -- in the CHARTS & RESEARCH section of the page, you will find a wealth of tools for selecting top sectors and stocks, including access to our exclusive realtime, intraday indicators.

For a 3-4 month free trial subscription, click here.

Commodities (Subscribers Only)

For complete charts of commodities, please visit your very own MyClues Home Page[http://clues.dhs.org:777/cgi-bin/myclues?myhome=yes&member=@@] -- in the CHARTS & RESEARCH section of the page, you will find links to webpages containing links to the following:

For a 3-4 month free trial subscription, click here.

CRB Index: http://clues.dhs.org:777/cgi-bin/myclues?chart=/:/futures/d/cr_a0.4903.html&member=wcorney@keatepartners.com

Follow the yellow brick road (see chart) . . . . Deflation is dead, bond yields will soon be rising, prices falling.

Format for printing. [Go back]

For Friday, September 13, 2002
© Bob Carver
$-Weighted OEX/QQQ Call/Put Ratios: 0.44/2.05
Popular Indices: http://clues.dhs.org:777/cgi-bin/myclues?chart=/:/indices/d/_spx.4903.html&member=@@ ^SPX · http://clues.dhs.org:777/cgi-bin/myclues?chart=/:/indices/d/_compq.4903.html&member=@@ ^IXQ · http://clues.dhs.org:777/cgi-bin/myclues?chart=/:/indices/d/_ndx.4903.html&member=@@ ^NDX · http://clues.dhs.org:777/cgi-bin/myclues?chart=/:/indices/d/_dj.4903.html&member=@@ ^DJI · http://clues.dhs.org:777/cgi-bin/myclues?chart=/:/indices/d/_mid.4903.html&member=@@ ^MID · http://clues.dhs.org:777/cgi-bin/myclues?chart=/:/indices/d/_oex.4903.html&member=@@ ^OEX · http://clues.dhs.org:777/cgi-bin/myclues?chart=/:/indices/d/_nya.4903.html&member=@@ ^NYA · http://clues.dhs.org:777/cgi-bin/myclues?chart=/:/indices/d/_vle.4903.html&member=@@ ^VLE · http://clues.dhs.org:777/cgi-bin/myclues?chart=/:/indices/d/_rut.4903.html&member=@@ ^RUT · http://clues.dhs.org:777/cgi-bin/myclues?chart=/:/indices/d/_sml.4903.html&member=@@ ^SML · http://clues.dhs.org:777/cgi-bin/myclues?chart=/:/futures/d/cr_a0.4903.html&member=@@ ^CRB · http://clues.dhs.org:777/cgi-bin/myclues?chart=/:/indices/d/_xau.4903.html&member=@@ ^XAU · http://clues.dhs.org:777/cgi-bin/myclues?chart=/:/indices/d/_btk.4903.html&member=@@ ^BTK · http://clues.dhs.org:777/cgi-bin/myclues?chart=/:/indices/d/_tyx.4903.html&member=@@ ^TYX
Sector Performance Since: 8 Apr 1999 · 18 Oct 1999 · A Week Ago · A Fortnight Ago
Sector Acceleration Since: 8 Apr 1999 · 18 Oct 1999 · A Week Ago · A Fortnight Ago

MyClues Home Page Link ("http://clues.dhs.org:777/cgi-bin/myclues?myhome=yes&member;[email protected]")

Special Note: our Internet Service Provider (ISP) is involved in a lawsuit with their ex-DSL partner. Consequently, we have switched the website to our alternate internet route, clues.dhs.org:777, until the legal matters are resolved.

New article from Elliott Wave International (free registration for Club Elliott Wave is required):

Is the Worst Over?

In this excerpt from this month's Elliott Wave Theorist, Bob Prechter writes about the public's persistence and bullishness. Is their confidence justified or is it just irrational optimism? Read for yourself as Bob explains the technical indicators and wave counts for the current market. The media believes the worst is over, but we know it's not.

Stocks: Trading Strategy

President Bush removed one big obstacle in his speech before the UN Thursday. That obstacle was a trading obstacle which was due to the risk of a surprise war on Iraq taking place. Bush put forth an ultimatum to Iraq and to the UN Security Council, namely that they abide by the Security Council resolutions which were already in effect. He challenged the UN to do their duty and enforce those resolutions. In the process, he revealed the game plan of the US. That game plan lays down the gauntlet for the UN to take action. And, if they don't, the US is ready and willing to do so itself.

The bottom line here is that the US must give Iraq and the UN ``first refusal rights'' to act on this issue. If Iraq fails to comply, the outcome is clear: the US, in conjunction with whichever allies have the backbone to stand up and be counted, will destroy not only Hussein, but all weapons and instruments of mass destruction. The heavily-veiled threat was a withdrawal of financial support for the UN itself from the US.

Thus, we have some breathing space here. The crude oil market sold off sharply — they got it. The bond market rallied, pulling money out of the stock market. Thus, the market closed down considerably from 911.

Our recent trading strategy was to avoid long side (bullish buys) trades in the belief that sudden events of war had the potential to impact our positions adversely and create sudden, sharp losses that we would be trapped in if the exchanges were closed. With the ``clearing of the air'' by Bush, we now believe that, although the trend is definitely still down, day-only long positions are justified at the proper time (such as when the indicators line up for such a position).

We still lean toward bearish positions (shorts), but one of the techniques we like to use involves buying lows and setting reversal sell stops as the market rallies. In other words, when we get a profitable long position in the futures, we set a trailing sell stop to take us out of the position should the market turn and head substantially lower. But, instead of simply selling out that long position, we sell a short position at the same time. For instance, if we are long 2 contracts, we would place a stop order to sell 4 contracts should the market drop to a particular price (a price we periodically raise as the market rallies). If this order is elected, we would then sell our 2 long contracts and additionally sell 2 more to get short.

Note: if you don't understand Elliott Waves, the following technical discussion should be skipped.
Elliott Waves favor a very bearish interpretation of current markets. However, since there are always alternative interpretations, we have to consider those alternate scenarios. The preferred interpretation is that we have completed a large degree wave 4 upward correction from the July 24th low in the Dow with the August 22nd high. Wave 1 (down) within the current large degree wave 5 down was completed on September 5th. Wave 2 (up) within wave 5 down was completed on Wednesday, September 11th. That now puts us in wave 1 (down) within wave 3 (down) within wave 5 down. The future course of the market from here would then call for a wave 2 (up) rally which retraces 50% or less of the current leg down. That preferred interpretation would have wave 3 (down) of wave 3 (down) within wave 5 down directly ahead. That's a waterfall decline like 1987, 1989, 1962, 1929, etc. Prechter calls it an ``imminent crash.''

Alternatives exist, however. The September 5th-11th rally could have been only wave a (up) within wave 2 (up). Under that alternative, the current leg down would be a wave b (down), to be followed by a wave c (up) rally to complete wave 2 (up). This alternative has some support from the patterns in bonds, which appear toppy here and could drop. Lately, when the bond market corrects downward, profit taking in the bonds tend to flow into the stock market as asset allocators, who by definition have to be in the market at all times, move that money into stock index products and the very liquid stocks. The thinking here is that a bond market correction would send that thundering herd of asset allocators back into the stock market. Another factor which supports this alternative is sentiment: although the QQQ traders are still in the stratosphere as far as being bullish is concerned, the OEX traders have been overly-bearish for more than a week. In the past, this has been a contrary indicator, suggesting stocks have room to rally. So, there are arguments in favor of this alternative.

With option expiration coming at the end of next week, we might possibly see a rally similar to the one leading up to May options expiration as option writers manipulate stocks higher to avoid having to take losses on their options. Yes, Virginia, stock market manipulators can do that.

The final alternative we'll mention is one Timothy Sharp has been advocating. He interprets the current rally from early September as a wave C rally within the upward wave 4 correction. If he is right, the S&P 500 Index could hit the 1000 mark by early October. Tim uses Median Lines and has been very successful with this technique in the last few months. However, as far as we are concerned, this is only a possible alternative, Elliott-wise. But, sentiment supports this interpretation.

We don't want to miss out on either the upside or the downside now with the risk of a sudden, surprise war on Iraq reduced. With that risk lowered (not completely eliminated, of course), we will take bullish (long) trading positions on a day trade basis as well as bearish (short) trading positions when the indicators line up.

For those who are trading this market, more specific commentary can be found on our Trading Page.

Format for printing. [Go back]

For Thursday, September 12, 2002
© Bob Carver
$-Weighted OEX/QQQ Call/Put Ratios: 0.72/6.83
Popular Indices: http://clues.dhs.org:777/cgi-bin/myclues?chart=/:/indices/d/_spx.4903.html&member=@@ ^SPX · http://clues.dhs.org:777/cgi-bin/myclues?chart=/:/indices/d/_compq.4903.html&member=@@ ^IXQ · http://clues.dhs.org:777/cgi-bin/myclues?chart=/:/indices/d/_ndx.4903.html&member=@@ ^NDX · http://clues.dhs.org:777/cgi-bin/myclues?chart=/:/indices/d/_dj.4903.html&member=@@ ^DJI · http://clues.dhs.org:777/cgi-bin/myclues?chart=/:/indices/d/_mid.4903.html&member=@@ ^MID · http://clues.dhs.org:777/cgi-bin/myclues?chart=/:/indices/d/_oex.4903.html&member=@@ ^OEX · http://clues.dhs.org:777/cgi-bin/myclues?chart=/:/indices/d/_nya.4903.html&member=@@ ^NYA · http://clues.dhs.org:777/cgi-bin/myclues?chart=/:/indices/d/_vle.4903.html&member=@@ ^VLE · http://clues.dhs.org:777/cgi-bin/myclues?chart=/:/indices/d/_rut.4903.html&member=@@ ^RUT · http://clues.dhs.org:777/cgi-bin/myclues?chart=/:/indices/d/_sml.4903.html&member=@@ ^SML · http://clues.dhs.org:777/cgi-bin/myclues?chart=/:/futures/d/cr_a0.4903.html&member=@@ ^CRB · http://clues.dhs.org:777/cgi-bin/myclues?chart=/:/indices/d/_xau.4903.html&member=@@ ^XAU · http://clues.dhs.org:777/cgi-bin/myclues?chart=/:/indices/d/_btk.4903.html&member=@@ ^BTK · http://clues.dhs.org:777/cgi-bin/myclues?chart=/:/indices/d/_tyx.4903.html&member=@@ ^TYX
Sector Performance Since: 8 Apr 1999 · 18 Oct 1999 · A Week Ago · A Fortnight Ago
Sector Acceleration Since: 8 Apr 1999 · 18 Oct 1999 · A Week Ago · A Fortnight Ago

MyClues Home Page Link ("http://clues.dhs.org:777/cgi-bin/myclues?myhome=yes&member;[email protected]")

Whether you're a trader or an investor, here's a good read from Bernie Schaeffer's website: Why Prices Should Be Higher! by Nick Perry, or ``Markets can remain irrational longer than you can remain solvent.'' ("http://www.schaeffersresearch.com/sentiment/observations.asp?ID=6141")

Stocks:

Continuing the analogy with 1962's Crash and its aftermath, here's a chart showing the length of time each leg took:

So far in our market, we have seen a 21-trading-day rally, followed by a 10-day decline and a rally back. That 21-day rally we saw from July 24th to August 22nd was very weak, falling well short of the time we would have expected it to take (we had expected it would take around 28 or 29 days as we wrote in our Special Report: The 1962 Stock Market Crash Analogy With 2002). It, however, played out essentially the same structure in terms of waves as the 1962 wave 4 rally. The little bounce rally we've seen over the last week appears to have ended now, ushering the way for a waterfall decline to new lows.

The manipulation that was evident in the market at the close Tuesday (the September S&P 500 futures contract closed exactly at 911) saw a gap up on the opening Wednesday. However, that buying support disappeared very quickly at about the time our Time Ratio projection method said we should see a top. The market continued lower, breaking below support lines near the close. The futures continued selling off after the cash market closed, setting up a substantial discount to the cash market.

That poor breadth figure we mentioned yesterday on the NASDAQ (1522 advancers to 1778 decliners) was a hint of the top in the making. Apparently, the market manipulators (Plunge Protection Team at work here?) pushed NASDAQ stocks higher in the lightly-traded afterhours session, turning those figures around. On Wednesday, about the same number of stocks advanced (1575) as declined (1566).

From here the market is likely to attempt to retest Wednesday's high by rallying up to the old support line. We will be looking for the usual list of suspects: weak NASDAQ relative to the blue chips, poor breadth, lopsided sentiment, etc., to trigger a sell signal for short term traders.

Speaking of sentiment, the OEX pit was relatively cautious toward the rally, with only 72¢ going into upside bets for every dollar of downside bets. However, the QQQ traders were much more bullish, pouring over $6 into calls for every $1 of puts.

Format for printing. [Go back]

For Wednesday, September 11, 2002
© Bob Carver
$-Weighted OEX/QQQ Call/Put Ratios: 0.60/1.70
Special Note: our Internet Service Provider (ISP) is involved in a lawsuit with their ex-DSL partner. Consequently, we have switched the website to our alternate internet route, clues.dhs.org:777, until the legal matters are resolved.

Popular Indices: http://clues.dhs.org:777/cgi-bin/myclues?chart=/:/indices/d/_spx.4903.html&member=@@ ^SPX · http://clues.dhs.org:777/cgi-bin/myclues?chart=/:/indices/d/_compq.4903.html&member=@@ ^IXQ · http://clues.dhs.org:777/cgi-bin/myclues?chart=/:/indices/d/_ndx.4903.html&member=@@ ^NDX · http://clues.dhs.org:777/cgi-bin/myclues?chart=/:/indices/d/_dj.4903.html&member=@@ ^DJI · http://clues.dhs.org:777/cgi-bin/myclues?chart=/:/indices/d/_mid.4903.html&member=@@ ^MID · http://clues.dhs.org:777/cgi-bin/myclues?chart=/:/indices/d/_oex.4903.html&member=@@ ^OEX · http://clues.dhs.org:777/cgi-bin/myclues?chart=/:/indices/d/_nya.4903.html&member=@@ ^NYA · http://clues.dhs.org:777/cgi-bin/myclues?chart=/:/indices/d/_vle.4903.html&member=@@ ^VLE · http://clues.dhs.org:777/cgi-bin/myclues?chart=/:/indices/d/_rut.4903.html&member=@@ ^RUT · http://clues.dhs.org:777/cgi-bin/myclues?chart=/:/indices/d/_sml.4903.html&member=@@ ^SML · http://clues.dhs.org:777/cgi-bin/myclues?chart=/:/futures/d/cr_a0.4903.html&member=@@ ^CRB · http://clues.dhs.org:777/cgi-bin/myclues?chart=/:/indices/d/_xau.4903.html&member=@@ ^XAU · http://clues.dhs.org:777/cgi-bin/myclues?chart=/:/indices/d/_btk.4903.html&member=@@ ^BTK · http://clues.dhs.org:777/cgi-bin/myclues?chart=/:/indices/d/_tyx.4903.html&member=@@ ^TYX
Sector Performance Since: 8 Apr 1999 · 18 Oct 1999 · A Week Ago · A Fortnight Ago
Sector Acceleration Since: 8 Apr 1999 · 18 Oct 1999 · A Week Ago · A Fortnight Ago

MyClues Home Page Link ("http://clues.dhs.org:777/cgi-bin/myclues?myhome=yes&member;[email protected]")

New article from Elliott Wave International (free registration for Club Elliott Wave is required):

Peace & War: The Socionomic Explanation

Even in this time of uncertainty, you can understand EXACTLY what is driving the markets, the economy, politics and social trends. Bob Prechter has proposed a brand-new science, called socionomics, that applies the Wave Principle to social and cultural trends. This new Club article, Peace & War: The Socionomic Explanation, will teach you a whole new way of looking at the world.

Stocks: 911 Rally Continues

The patriotic 911 rally in the stock market continued on Tuesday, although it's showing signs of running out of steam. We're counting the rally as a wave 2 rally in a final bear market leg down into the 2-year cycle low due soon.

So far, we haven't gotten a halfway (50%) retracement of the August 22-September 5 wave 1 down on any index. It's not an absolute certainty that we will get one, but that would be normal for a wave 2. The 50% retracement level on the Dow Industrials is at 8647.03, on the S&P 500 Index (SPX) at 917.75, and on the NASDAQ-100 (NDX) at 967.67.

If you're encouraged to be bullish by this rally, don't be. Breadth has been poor for a rally. On Tuesday, there were 1522 stocks on the NASDAQ which ended higher. But, there were more stocks ending lower: 1778. When the NDX generals are rising while the troops are in retreat, it's not a healthy rally. In fact, it's exactly what we've called it: a bear market rally with a foundation built on sand, not stone. At some point soon, this rally will fail.

Some of the impetus for the rise Tuesday was that traders noted that when the market went into the July the 4th Holiday, there was great fear of a terrorist attack. After that holiday, the market rallied sharply higher. We would note that the market declined into the 4th of July; this market is rallying into 911. That's a big difference: this market is extremely overbought while the 4th of July market was extremely oversold.

We have several Time Ratio Highs due on 911, as well as 912 (Thursday). The short term patterns point to this high being very significant — a multi-thousand point drop in the Dow Jones Industrials from here is possible. Once we're past the scheduled 2-year cycle low, however, the potential reward for being invested in stocks should be outstanding (especially if that waterfall decline occurs).

Format for printing. [Go back]

For Tuesday, September 10, 2002
© Bob Carver
$-Weighted OEX/QQQ Call/Put Ratios: 0.54/2.38
Popular Indices: http://www.marketclues.net/cgi-bin/myclues?chart=/:/indices/d/_spx.4903.html&member=@@ ^SPX · http://www.marketclues.net/cgi-bin/myclues?chart=/:/indices/d/_compq.4903.html&member=@@ ^IXQ · http://www.marketclues.net/cgi-bin/myclues?chart=/:/indices/d/_ndx.4903.html&member=@@ ^NDX · http://www.marketclues.net/cgi-bin/myclues?chart=/:/indices/d/_dj.4903.html&member=@@ ^DJI · http://www.marketclues.net/cgi-bin/myclues?chart=/:/indices/d/_mid.4903.html&member=@@ ^MID · http://www.marketclues.net/cgi-bin/myclues?chart=/:/indices/d/_oex.4903.html&member=@@ ^OEX · http://www.marketclues.net/cgi-bin/myclues?chart=/:/indices/d/_nya.4903.html&member=@@ ^NYA · http://www.marketclues.net/cgi-bin/myclues?chart=/:/indices/d/_vle.4903.html&member=@@ ^VLE · http://www.marketclues.net/cgi-bin/myclues?chart=/:/indices/d/_rut.4903.html&member=@@ ^RUT · http://www.marketclues.net/cgi-bin/myclues?chart=/:/indices/d/_sml.4903.html&member=@@ ^SML · http://www.marketclues.net/cgi-bin/myclues?chart=/:/futures/d/cr_a0.4903.html&member=@@ ^CRB · http://www.marketclues.net/cgi-bin/myclues?chart=/:/indices/d/_xau.4903.html&member=@@ ^XAU · http://www.marketclues.net/cgi-bin/myclues?chart=/:/indices/d/_btk.4903.html&member=@@ ^BTK · http://www.marketclues.net/cgi-bin/myclues?chart=/:/indices/d/_tyx.4903.html&member=@@ ^TYX
Sector Performance Since: 8 Apr 1999 · 18 Oct 1999 · A Week Ago · A Fortnight Ago
Sector Acceleration Since: 8 Apr 1999 · 18 Oct 1999 · A Week Ago · A Fortnight Ago

MyClues Home Page Link ("http://clues.dhs.org:777/cgi-bin/myclues?myhome=yes&member;[email protected]")

Has It Paid To "Follow" the Fed? Yes, this is a provocative question ... just think of all the people who would squirm if they had to answer it.
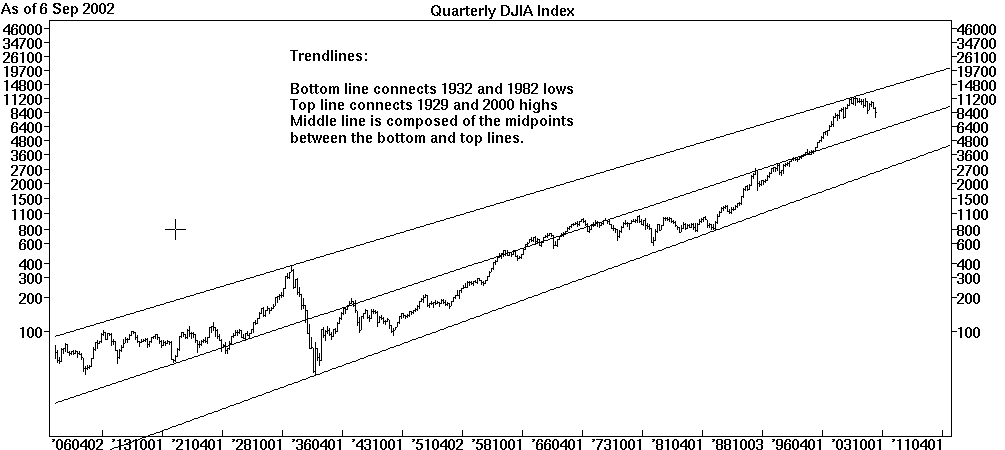
Click here to read an excerpt of "Conquer the Crash".

Stocks: Patriotic Rally Resumes

The low last week will probably be taken out soon, but the patriotic 911 rally seems to still have some life left in it. After opening lower, the market formed five waves down and started to rally, quickly retracing half its losses. The market fell back to test the early lows, found little selling pressure and started up. Although there was very low volume on the rally, the bears apparently decided to sit it out. The market finished up for the day, but on very poor breadth.

Sentiment remains mixed, with the OEX options trading pit quite bearish (which is short term bullish) and the QQQ traders quite bullish. Since the NASDAQ-100 upon which the QQQs are based has been consistently weaker than the OEX, we think the QQQ traders are wrong but for the very short term.

Money Flow has been extremely poor. Last week, tremendous selling pressure on the S&P 500 Index suggested that the downtrend was worsening. This week, despite the rally, the money flow measures show little buying pressure. In other words, this market is moving uphill on fumes alone. The power of faith, perhaps? Note that the Money Flow Line in the quarter-hourly S&P 500 chart closed on its low despite the rally. This was due to heavier volume on the sell side in the last hour of trading. If this were a bull market, we would have seen strong money flow last week into stocks on the dip, as well as strong money flow into the last hour of trading Monday. We saw just the opposite. Risk here is for lower prices (30% lower by our estimate) while potential maximum reward is about 10%. Until we get past the 2-year cycle low, we'll remain very cautious in this bear market.

We think the event risk here is substantial. We're referring to the inevitable announcement that we're at war with Iraq. Now, chances are that the war won't build up to its full fury until next month, but with this market rising on light volume, we don't want to get caught in a bullish position when news sends the market into free-fall. Even though we did identify the rally in realtime, we did not buy. Short positions carry less risk at the present time.

This short term rally had traced out three waves up by mid-afternoon and entered what we believe to be a fourth wave correction. We're counting this very short term move up that started Monday morning as a wave c upward correction that will unfold in five waves, then reverse to the downside. That implies we should have at least one more leg up in the rally before it ends either Tuesday or Wednesday (911). We have a couple of Time Ratio Highs due on both days, so we'll be watching the intraday wave patterns and other indicators to help confirm the top.

We had an Internet connectivity failure late in the session at our Internet Service Provider. This problem should be fixed by the time you receive this message.

Format for printing. [Go back]

For Monday, September 9, 2002
© Bob Carver
$-Weighted OEX/QQQ Call/Put Ratios: 0.62/2.78
Popular Indices: http://www.marketclues.net/cgi-bin/myclues?chart=/:/indices/d/_spx.4903.html&member=@@ ^SPX · http://www.marketclues.net/cgi-bin/myclues?chart=/:/indices/d/_compq.4903.html&member=@@ ^IXQ · http://www.marketclues.net/cgi-bin/myclues?chart=/:/indices/d/_ndx.4903.html&member=@@ ^NDX · http://www.marketclues.net/cgi-bin/myclues?chart=/:/indices/d/_dj.4903.html&member=@@ ^DJI · http://www.marketclues.net/cgi-bin/myclues?chart=/:/indices/d/_mid.4903.html&member=@@ ^MID · http://www.marketclues.net/cgi-bin/myclues?chart=/:/indices/d/_oex.4903.html&member=@@ ^OEX · http://www.marketclues.net/cgi-bin/myclues?chart=/:/indices/d/_nya.4903.html&member=@@ ^NYA · http://www.marketclues.net/cgi-bin/myclues?chart=/:/indices/d/_vle.4903.html&member=@@ ^VLE · http://www.marketclues.net/cgi-bin/myclues?chart=/:/indices/d/_rut.4903.html&member=@@ ^RUT · http://www.marketclues.net/cgi-bin/myclues?chart=/:/indices/d/_sml.4903.html&member=@@ ^SML · http://www.marketclues.net/cgi-bin/myclues?chart=/:/futures/d/cr_a0.4903.html&member=@@ ^CRB · http://www.marketclues.net/cgi-bin/myclues?chart=/:/indices/d/_xau.4903.html&member=@@ ^XAU · http://www.marketclues.net/cgi-bin/myclues?chart=/:/indices/d/_btk.4903.html&member=@@ ^BTK · http://www.marketclues.net/cgi-bin/myclues?chart=/:/indices/d/_tyx.4903.html&member=@@ ^TYX
Sector Performance Since: 8 Apr 1999 · 18 Oct 1999 · A Week Ago · A Fortnight Ago
Sector Acceleration Since: 8 Apr 1999 · 18 Oct 1999 · A Week Ago · A Fortnight Ago

MyClues Home Page Link ("http://clues.dhs.org:777/cgi-bin/myclues?myhome=yes&member;[email protected]")

Has It Paid To "Follow" the Fed? Yes, this is a provocative question ... just think of all the people who would squirm if they had to answer it.

Click here to read an excerpt of "Conquer the Crash".

Stocks: A Long Term Look at the Dow Industrials

Recently, we published a chart of the S&P 500 Index showing how it had been moving within a well-defined trend channel from the early 20th Century to the present. This weekend, we are doing the same for the Dow Jones Industrials Average (chart is above: for plaintext readers, visit the website and click on ``This Week's Market Commentary'' to view in your browser).

One major difference between the Dow chart and the S&Ps is that while the S&Ps reached the middle line — the centerpost around which the market has found its median valuation over the long haul — the Dow Industrials remain well above that line at the present time. This suggests that the 30 stocks in the senior average have held up better as a group than the bulk of the 500 stocks in the S&P 500 Index.

We need to review the history and behavior of this bear market to date to get some perspective. Initially, the high tech stock concentration on NASDAQ caused that sector to be the weakest part of the market and it has been in a severe downtrend, with only brief, sporadic rallies since its March 2000 high. The S&P 500 held up only slightly better than the NASDAQ due to its own high concentration of technology stocks. The Dow Industrials held up much better overall that the other two until September 2001 when it collapsed due to the WTC attack.

However, we mustn't forget that while those three indices were in solid bear markets of varying degree, we had continuing bull markets in the small and mid cap sectors. Those bull markets ended in April 2002, 25 months after the peak in NASDAQ. For instance, the S&P 600 Small Cap Index (SML) made an all-time high at 258.23 on April 17th and retested that high on May 15th (258.09). Since April, however, virtually all market sectors have been trending lower in what is indisputably a secular (long term) bear market. We're now in the 31st month, nearing a 2-year cycle low due next month. Following that low, we should see a cyclical bull market which could be similar to the 1932-1937 bull move that occured. We're at almost the same point in time as the beginning of the 1932 bull market (31 months into the decline for us, 34 months back in '32). We expect our bull market to be somewhat more subdued in its extent than the one in the 'Thirties, but certainly worth participation on an investment basis.

The position of the Dow as it stands ``betwixt and between'' those upper and middle trendlines presents us with a picture similar to what we've seen with the small and mid cap sectors. That is, the damage done to NASDAQ and the S&P 500 greatly exceeds other sectors. The obvious question is, ``Will the Dow join the S&P 500 in testing that middle line?''

At this point, it's difficult to see it happening soon. Given the impending landing of the 2-year cycle low next month, the Dow would have to drop to about 5700 for it to test that middle line. That large a drop (about 2700 points from the Dow's Friday close of 8427) seems unlikely. But, don't dismiss that possibility entirely because prices are set by the last transaction between buyer and seller and panic can produce some very large price moves in a short span of time. If we assume the likely outcome of the Dow being able to bottom well above that middle line and that it is able to rally off the 2-year low for about a year, the next leg down is likely to test that middle line. In 2004, the middle line is going to be around 6700.

The bottom line is currently at 2500. That price represents historic undervaluation such as we saw in 1932, 1974 or 1982. By 2006, that line moves up to just over 3100. By 2010, the line exceeds the 4000 level. Those prices should set the absolute lower bounds for this secular bear market. If you read Walter Bressert's recent Special Report (available for free at www.WalterBressert.com), you know that he is forecasting the bear market to end in either 2006 or 2010.

However, if this bear market adheres to the timing of the 1929-1942 secular bear market, the low would occur in 2013. At that time, the lower line in the Dow will be in the vicinity of 5000.

Which brings us to Bill Gross and Terry Laundry, who both present outstanding arguments as to why stocks are likely to underperform for an extended period of time. Bill Gross is the largest bond investor in the world, managing about $270 billion. He thinks fair value for the Dow is about 5000 and he makes some pretty convincing arguments for that stance. A brief summary can be found here ("http://biz.yahoo.com/rf/020906/financial_pimco_gross_1.html").

Terry Laundry uses mostly technical analysis, but has been delving into the fundamental side of things lately. His latest website update at T-Theory ("http://www.ttheory.com") presents some interesting charts of valuation.

All this doesn't mean the stock market is going to plunge 30% overnight. But, it does mean that the underlying trend is going to be flat to down for some time to come. If there's one positive to be seen from that Dow Industrials chart above, though, it's that we may be seeing a market ahead not unlike that at the extreme left, from 1900 to 1921. Essentially, that means a very long period of time when the market has zero trend, but moves up and down in a broad trading range. In other words, market timing will be essential for investors.

Investors are going to have to become more trading oriented and not get married to their stock positions. Familiarize yourself with stop loss orders: enter a Good-Til-Canceled order with your broker for each stock you hold. Martha Stewart certainly wishes she had (it would have eliminated any question of possible illegal insider trading).

War on Iraq
The market is greatly concerned with the impending War on Iraq. Friday's rally was quite subdued and we think most of the lack of additional rally after the gap opening higher was due to worries about the war. The coalition air forces have stepped up their attacks on Iraqi military installations (about 100 warplanes attacked an Iraqi airfield Thursday). This activity sent crude oil futures soaring to new contract highs Friday.

The war could begin at any time, but we think the current activity is simply a ``softening-up'' operation to see how resilient the Iraqi defenses are before a more sustained attack in early October. Reasons why we think the 6th of October is the most likely date for the War on Iraq to officially begin:

  1. It's the time of the next new moon (Sunday, October 6th). Air strikes are best conducted under the darkest of conditions — it doesn't get darker than nights around the new moon. Note that the 1991 Gulf War and the recent Afghanistan air strikes commenced on new moon dates.

  2. The US Congress goes into recess on October 4th. In other words, reporters won't be able to get instant reactions from Congress as easily.

  3. Congressional elections occur the day after the new moon in November. Starting an air war the day before the elections would subject the Administration to cries of attempted manipulation.

When the war does begin, the stock market is likely to sell off sharply. If our timing is correct, the war will begin at the 2-year cycle low — an ideal time to buy.

Short Term
The NASDAQ retraced 72% of its August rally, confirming that the recent rise was a rally in a bear market. The S&P 500 Index, however, found support after giving back only 50% of its July-August rise. The Dow was only a little weaker than the S&P 500, giving back slightly more than half.

The broader indices (Value Line, Mid Cap, Small Cap) retraced half or slightly less than half of their rallies.

Since halfway retracements are typical of wave 2 reactions (corrections) within an emerging bull market, the short term trend is mixed at this point. The NASDAQ, however, clearly remains in a bear market. We think NASDAQ will need to take the lead before we can declare a new bull market. Consequently, we remain in cash in our investment accounts, while looking for low risk trading opportunities on a daily basis (see our Trading Page for intraday updates).

Euro Currency: http://www.marketclues.net/cgi-bin/myclues?chart=/:/futures/d/ec_a0.4903.html&member=wcorney@keatepartners.com

The Euro completed its wave B rally and appears to be in a sharp wave C decline now. New lows for this correction lie directly ahead.

U.S. Dollar Index: http://www.marketclues.net/cgi-bin/myclues?chart=/:/futures/d/dx_a0.4903.html&member=wcorney@keatepartners.com

The Dollar Index, an inverted image of the Euro at this point, has completed its wave B decline and has entered a wave C rally. Overall, the Dollar Index is in a bear market corrective pattern which will eventually see the US dollar much lower. But, for now, a rally.

Australian Dollar: http://www.marketclues.net/cgi-bin/myclues?chart=/:/futures/d/ad_a0.4903.html&member=wcorney@keatepartners.com

As we expected, the 50% retracement level in the Aussie Dollar provided stiff resistance. Support was found on the long term support lines in the chart. That support appears likely to break and send the A$ tumbling to test the old lows.

Canadian Dollar: http://www.marketclues.net/cgi-bin/myclues?chart=/:/futures/d/cd_a0.4903.html&member=wcorney@keatepartners.com

We saw five waves in the A-wave decline, then a weak wave B rally. At this point, the Canadian Dollar should continue to decline in wave C to a new low below 62.52¢.

S&P Toronto Stock Exchange: http://www.marketclues.net/cgi-bin/myclues?chart=/:/indices/d/_sptse.4903.html&member=wcorney@keatepartners.com

Like many stock markets, the TSE Index is held hostage to trends in the US. We do have a Time Ratio Low due Friday which could provide a turn (Time Ratios can and do invert, especially during times when the underlying trend is changing).

Australian All Ordinaries: http://www.marketclues.net/cgi-bin/myclues?chart=/:/indices/d/_aord.4903.html&member=wcorney@keatepartners.com

The fifth wave (down) from the intermediate top in March started on the 23rd of August. We have a Time Ratio Low due right at the end of September and that may mark the bottom. However, since the Australian market is likely to be adversely affected by war, the actual price low could be delayed to coincide with the US market bottom.

Like many of the stronger US indices, the All-Ords did retrace slightly less than half of their recent rally, which keeps alive the hope that a new bull market has started. However, we think risk is still extremely high that either a lower low, or a retest of the prior low, is ahead and remain cautious at this time. A rally which breaks the resistance polytrendline overhead would be bullish and force a reassessment of the bullish case.

Australia Business News http://www.abc.net.au/news/business/default.htm
Yahoo! Australia Business News http://au.dailynews.yahoo.com/Full_Coverage/Australian_Economy/

London Financial-Times 100: http://www.marketclues.net/cgi-bin/myclues?chart=/:/indices/d/_ftse.4903.html&member=wcorney@keatepartners.com

As in the Australian market, the end of September is the most likely date for a conclusion of this cyclic bear market and the beginning of a cyclic bull market, but the actual beginning date is more likely to be tied to the reality of war.

Bonds / Interest Rates:

Rates are scheduled to be making their lows in September. However, as in the foreign stock markets, bonds are hostage to the international situation. US bonds are considered a safe haven investment generally and could benefit from ``flight to safety'' buying pressure.

Target 2030 Zero Coupon Bond Fund Quote

Sectors and Individual Stocks (Subscribers Only)

For tables ranking sectors and individual stocks, and links to charts of 3500 individual stocks and sectors, please visit your very own MyClues Home Page[http://www.marketclues.net/cgi-bin/myclues?myhome=yes&member=@@] -- in the CHARTS & RESEARCH section of the page, you will find a wealth of tools for selecting top sectors and stocks, including access to our exclusive realtime, intraday indicators.

For a 3-4 month free trial subscription, click here.

Commodities (Subscribers Only)

For complete charts of commodities, please visit your very own MyClues Home Page[http://www.marketclues.net/cgi-bin/myclues?myhome=yes&member=@@] -- in the CHARTS & RESEARCH section of the page, you will find links to webpages containing links to the following:

For a 3-4 month free trial subscription, click here.

CRB Index: http://www.marketclues.net/cgi-bin/myclues?chart=/:/futures/d/cr_a0.4903.html&member=wcorney@keatepartners.com

The CRB Index continues to break out to new relative highs. This confirms the days of bond bull market are limited and that a cyclical bull market in stocks is warming up in the wings.

And, deflation is on the ropes.

Format for printing. [Go back]

For Friday, August 30, 2002
© Bob Carver
$-Weighted OEX/QQQ Call/Put Ratios: 0.57/0.58
Popular Indices: http://www.marketclues.net/cgi-bin/myclues?chart=/:/indices/d/_spx.4903.html&member=@@ ^SPX · http://www.marketclues.net/cgi-bin/myclues?chart=/:/indices/d/_compq.4903.html&member=@@ ^IXQ · http://www.marketclues.net/cgi-bin/myclues?chart=/:/indices/d/_ndx.4903.html&member=@@ ^NDX · http://www.marketclues.net/cgi-bin/myclues?chart=/:/indices/d/_dj.4903.html&member=@@ ^DJI · http://www.marketclues.net/cgi-bin/myclues?chart=/:/indices/d/_mid.4903.html&member=@@ ^MID · http://www.marketclues.net/cgi-bin/myclues?chart=/:/indices/d/_oex.4903.html&member=@@ ^OEX · http://www.marketclues.net/cgi-bin/myclues?chart=/:/indices/d/_nya.4903.html&member=@@ ^NYA · http://www.marketclues.net/cgi-bin/myclues?chart=/:/indices/d/_vle.4903.html&member=@@ ^VLE · http://www.marketclues.net/cgi-bin/myclues?chart=/:/indices/d/_rut.4903.html&member=@@ ^RUT · http://www.marketclues.net/cgi-bin/myclues?chart=/:/indices/d/_sml.4903.html&member=@@ ^SML · http://www.marketclues.net/cgi-bin/myclues?chart=/:/futures/d/cr_a0.4903.html&member=@@ ^CRB · http://www.marketclues.net/cgi-bin/myclues?chart=/:/indices/d/_xau.4903.html&member=@@ ^XAU · http://www.marketclues.net/cgi-bin/myclues?chart=/:/indices/d/_btk.4903.html&member=@@ ^BTK · http://www.marketclues.net/cgi-bin/myclues?chart=/:/indices/d/_tyx.4903.html&member=@@ ^TYX
Sector Performance Since: 8 Apr 1999 · 18 Oct 1999 · A Week Ago · A Fortnight Ago
Sector Acceleration Since: 8 Apr 1999 · 18 Oct 1999 · A Week Ago · A Fortnight Ago

MyClues Home Page Link ("http://clues.dhs.org:777/cgi-bin/myclues?myhome=yes&member;[email protected]")

http://www.elliottwave.com/a.asp?url=affiliates/ctc/081502ClubWelling.pdf&cn=mktclue In an interview with Kathryn Welling, Bob Prechter goes against the grain and discusses his perspective on bull vs. bear strategies, safe banks, the Fed and institutional investors. This interview is in Adobe Acrobat format. In order to view it you will need the most recent version of the Adobe Acrobat Reader. You can download this software, free of charge, from Adobe's Web Site.
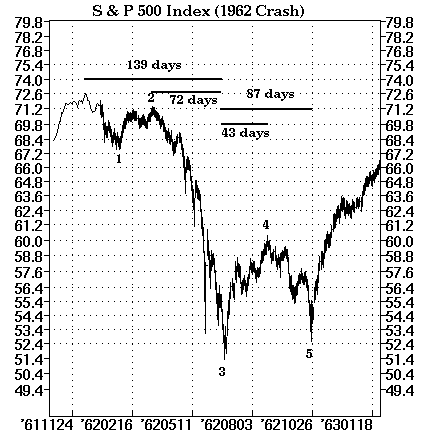
Stocks: Recession-Level Unemployment

The government reported that unemployment claims are at recession levels and growing. Remember, the National Bureau of Economic Research dates the current recession starting in March 2001 and has yet to announce it has ended. It was certainly clear Thursday morning that the recession has not ended. Unemployment claims jumped ``unexpectedly'' above the recession-level 400,000 mark, confirming that the economy's recent bounce ended several months ago. The experts got it completely wrong again.

In any case, whether this is an official recession or not, it's not debatable that this is an economy incapable of producing sufficient growth to boost either employment or profits. It thus confirms the message the stock market has been sending us: that stock prices are too high in this kind of economy. Thus, the recent rebound in stock prices on little more than hope was an ephemeral rally that only serves to suck cash out of gullible investors and into sinking equities. Bear market rallies are designed to do just that at the expense of the less-savvy investor. And, who do you blame? The broker who's just trying to make his commission? The analyst who's just trying to get a kickback from his investment banking client? The company CEO who's just trying to raid the corporate treasury before the company goes belly up? It's a cast of thousands. No, make that millions. But, it plays out in every bear market, especially so when there hasn't been a real bear market in over twenty years. There may be a sucker born every minute, but it takes a generation to grow a crop this big.

Technically, the market is in very bad shape. The top on August 22nd appears now to have been the final orthodox top in the rebound rally from the July and August lows. That doesn't mean the Dow might not be able to rally back to a slightly higher high in September, but it does mean the chances are dimming. And, it does mean we have much lower lows ahead in the NASDAQ. We will take the stance of Paul Desmond of Lowry's Reports (who appeared on Bubble-TV Thursday afternoon — one of the rare bears to be allowed to despoil their persisently rosy scenario) and won't predict how low is low. Mr Desmond suggested that predicting the low price is akin to predicting how much panic investors will have at the bottom: it's impossible to say for sure. Bob Prechter suggests the Dow will eventually drop below 400 by the time this bear market is over and who's to say that's crazy? In the madness of crowds, any price is possible, if only briefly.

The short term Elliott Wave picture suggests we could get a complete five-wave downmove by Friday afternoon. That would count as a wave 1 down within the overall wave 3 or wave 5 down on a larger scale. If the larger picture is that we are in a wave 3 down right now, we are in for a crash to S&P 500-600 after mid-September. If the larger picture is a wave 5 down, we are in for a retest of the July low in the SPX (could be higher or lower, we just don't have an estimate at this time). The latter count would parallel the 1962 market (see our Special Report for a chart of that 1962 market).

If we do get that short term bottom in place Friday afternoon, we should see a semmingly strong wave 2 countertrend rally into September that would unfold in three waves. With the professionals coming back to work next week, the rally is likely to be strong enough to convince the majority that the bear market is over.

Format for printing. [Go back]

For Thursday, August 29, 2002
© Bob Carver
$-Weighted OEX/QQQ Call/Put Ratios: 0.68/1.09
Popular Indices: http://www.marketclues.net/cgi-bin/myclues?chart=/:/indices/d/_spx.4903.html&member=@@ ^SPX · http://www.marketclues.net/cgi-bin/myclues?chart=/:/indices/d/_compq.4903.html&member=@@ ^IXQ · http://www.marketclues.net/cgi-bin/myclues?chart=/:/indices/d/_ndx.4903.html&member=@@ ^NDX · http://www.marketclues.net/cgi-bin/myclues?chart=/:/indices/d/_dj.4903.html&member=@@ ^DJI · http://www.marketclues.net/cgi-bin/myclues?chart=/:/indices/d/_mid.4903.html&member=@@ ^MID · http://www.marketclues.net/cgi-bin/myclues?chart=/:/indices/d/_oex.4903.html&member=@@ ^OEX · http://www.marketclues.net/cgi-bin/myclues?chart=/:/indices/d/_nya.4903.html&member=@@ ^NYA · http://www.marketclues.net/cgi-bin/myclues?chart=/:/indices/d/_vle.4903.html&member=@@ ^VLE · http://www.marketclues.net/cgi-bin/myclues?chart=/:/indices/d/_rut.4903.html&member=@@ ^RUT · http://www.marketclues.net/cgi-bin/myclues?chart=/:/indices/d/_sml.4903.html&member=@@ ^SML · http://www.marketclues.net/cgi-bin/myclues?chart=/:/futures/d/cr_a0.4903.html&member=@@ ^CRB · http://www.marketclues.net/cgi-bin/myclues?chart=/:/indices/d/_xau.4903.html&member=@@ ^XAU · http://www.marketclues.net/cgi-bin/myclues?chart=/:/indices/d/_btk.4903.html&member=@@ ^BTK · http://www.marketclues.net/cgi-bin/myclues?chart=/:/indices/d/_tyx.4903.html&member=@@ ^TYX
Sector Performance Since: 8 Apr 1999 · 18 Oct 1999 · A Week Ago · A Fortnight Ago
Sector Acceleration Since: 8 Apr 1999 · 18 Oct 1999 · A Week Ago · A Fortnight Ago

MyClues Home Page Link ("http://clues.dhs.org:777/cgi-bin/myclues?myhome=yes&member;[email protected]")

http://www.elliottwave.com/a.asp?url=affiliates/ctc/081502ClubWelling.pdf&cn=mktclue In an interview with Kathryn Welling, Bob Prechter goes against the grain and discusses his perspective on bull vs. bear strategies, safe banks, the Fed and institutional investors. This interview is in Adobe Acrobat format. In order to view it you will need the most recent version of the Adobe Acrobat Reader. You can download this software, free of charge, from Adobe's Web Site.
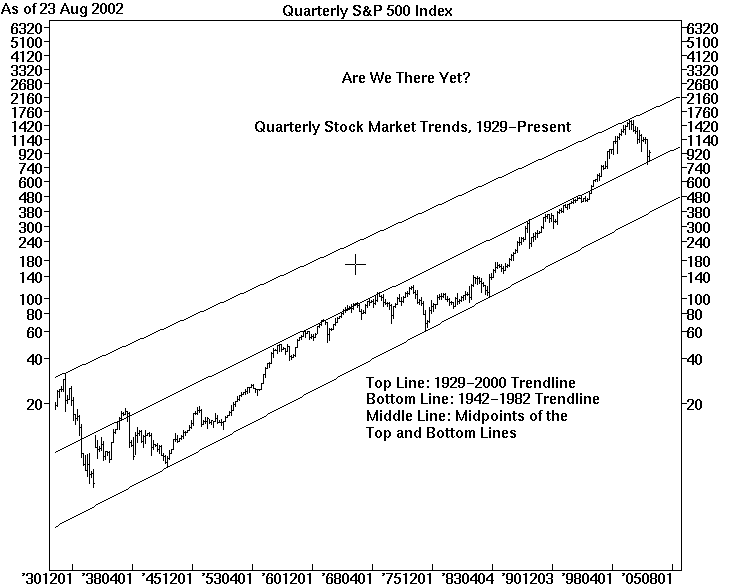
Stocks: Low Volume Slide

The NASDAQ-100 Index (NDX) has now given back over half of all its gains since its bear market low. For everyone who was afraid of missing the next bull market, this fact should remind you that bear market rallies are swift, cover a lot of ground — and give it all back.

The potential for a contracting triangle in the Dow was invalidated early Wednesday as that average broke below its previous low. This pullback is, most likely, setting the market up for a run to test the 9100 level. Certainly, such a run on the headline Dow would help draw in more sideline cash before the market heads down to retest the July low. Several Time Ratio turning points occur next week and the return of the pros from their vacation retreats should inject quite a bit more liquidity back into the market. This week has been volatile due to the very thin order books. According to Art Cashin, Director of Floor Operations with UBS Paine Webber, who was interviewed by Bubble-TV Wednesday afternoon, stock prices are being moved around on much fewer shares than normal. We will welcome next week when the order books will, presumably, have much better depth.

A late-day trading example illustrated how relatively light order books can move the market. A brief spurt of buying in the Dow stocks sent the average soaring from the mid-8600 area to the mid-8700 area — almost 100 Dow points in just about 10 minutes. However, there was no follow-thru buying and the market quickly fell back. Traders who were waiting for a breakout could have been fooled into buying the breakout, then seeing their position turn into a loss very quickly. Thin volume does this, so it will be nice to see volume return to normal next week.

This selloff is likely to see a rally back, even in the NASDAQ. Although we don't think the NASDAQ will make a new recovery high, such a feat is entirely possible in the Dow. That retracement rally will give traders an even better short entry.

At the present time, it appears that the low coming up this Fall as the 2-year cycle bottoms is going to provide an excellent time to buy for longer term investors. It's generally not a good idea to buy the momentum low in a down market because the bounce rally that follows is usually quite selective. The better investment strategy is to keep your cash safe in an interest-bearing account or Treasury bills, biding your time for the retest of the low to come. There's no guarantee the market will bottom above or below the prior low. Most often, the second low will be below the first low. That was the case in 1994 and 1987 with the S&P 500 Index. However, it was not the case with the Dow Industrials, which held above its prior low in both cases. Still, the point is not to try to catch the exact lowest low, but to catch the lowest risk entry point. Anyone can be a daredevil and try to catch a falling knife, but the prudent will wait for it to stick in the ground and stop quivering before attempting to pick it up.

We think the market will be following the pattern laid out in 1962 (see the Special Report entitled, ``The 1962 Stock Market Crash Analogy With 2002'' for a chart of that bear market), with the second low the right place to do long term buying. Certainly, the strongest stocks will make considerably higher lows at that time. But, that just proves they're the strongest stocks and that they are the ones to buy. When the whole market turns up, those stronger stocks are likely to continue leading. This retest will also give us time to setup a list of strong stocks and observe their behavior leading up to the next low.

Unfortunately, we're in a secular (i.e., long term, probably around 13 years long) bear market. That means any bull market which gets started with the next low — the retest low — will not have the benefit of an underlying bullish trend. However, the same could be said of the 1932-1937 bull market and that bull market was the strongest of the Twentieth Century until the last half of the 'Nineties came along. We're hoping for a repeat of that experience: a five year bull market. From a long term perspective, that bull market was counted as a wave B rally in a secular bear market. But, it made fortunes for those who bought near the 1932 low and sold near the 1937 top.

Format for printing. [Go back]

For Wednesday, August 28, 2002
© Bob Carver
$-Weighted OEX/QQQ Call/Put Ratios: 0.72/3.30
Popular Indices: http://www.marketclues.net/cgi-bin/myclues?chart=/:/indices/d/_spx.4903.html&member=@@ ^SPX · http://www.marketclues.net/cgi-bin/myclues?chart=/:/indices/d/_compq.4903.html&member=@@ ^IXQ · http://www.marketclues.net/cgi-bin/myclues?chart=/:/indices/d/_ndx.4903.html&member=@@ ^NDX · http://www.marketclues.net/cgi-bin/myclues?chart=/:/indices/d/_dj.4903.html&member=@@ ^DJI · http://www.marketclues.net/cgi-bin/myclues?chart=/:/indices/d/_mid.4903.html&member=@@ ^MID · http://www.marketclues.net/cgi-bin/myclues?chart=/:/indices/d/_oex.4903.html&member=@@ ^OEX · http://www.marketclues.net/cgi-bin/myclues?chart=/:/indices/d/_nya.4903.html&member=@@ ^NYA · http://www.marketclues.net/cgi-bin/myclues?chart=/:/indices/d/_vle.4903.html&member=@@ ^VLE · http://www.marketclues.net/cgi-bin/myclues?chart=/:/indices/d/_rut.4903.html&member=@@ ^RUT · http://www.marketclues.net/cgi-bin/myclues?chart=/:/indices/d/_sml.4903.html&member=@@ ^SML · http://www.marketclues.net/cgi-bin/myclues?chart=/:/futures/d/cr_a0.4903.html&member=@@ ^CRB · http://www.marketclues.net/cgi-bin/myclues?chart=/:/indices/d/_xau.4903.html&member=@@ ^XAU · http://www.marketclues.net/cgi-bin/myclues?chart=/:/indices/d/_btk.4903.html&member=@@ ^BTK · http://www.marketclues.net/cgi-bin/myclues?chart=/:/indices/d/_tyx.4903.html&member=@@ ^TYX
Sector Performance Since: 8 Apr 1999 · 18 Oct 1999 · A Week Ago · A Fortnight Ago
Sector Acceleration Since: 8 Apr 1999 · 18 Oct 1999 · A Week Ago · A Fortnight Ago

MyClues Home Page Link ("http://clues.dhs.org:777/cgi-bin/myclues?myhome=yes&member;[email protected]")

http://www.elliottwave.com/a.asp?url=affiliates/ctc/081502ClubWelling.pdf&cn=mktclue In an interview with Kathryn Welling, Bob Prechter goes against the grain and discusses his perspective on bull vs. bear strategies, safe banks, the Fed and institutional investors. This interview is in Adobe Acrobat format. In order to view it you will need the most recent version of the Adobe Acrobat Reader. You can download this software, free of charge, from Adobe's Web Site.
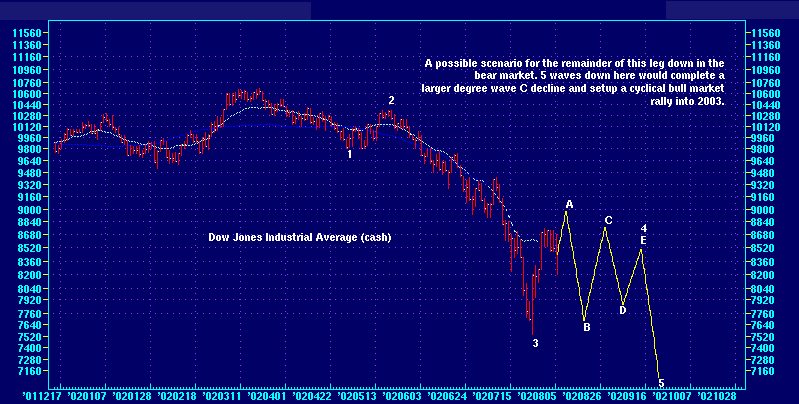
Stocks: Wavering on the Edge of the Cliff

The market wavered on the edge of the cliff we call wave 5 down on Tuesday. The NASDAQ-100 Index (NDX) — our lead dog index — went right over the cliff, warning us of an imminent tumble to retest the July and August lows. Sentiment was far into the overly-bullish category in the QQQ options, indicating that speculators were avidly buying the dip, not a good sign at all if you want prices to rise.

OEX players were much closer to overly-bearish, however, which suggests the market may actually make a slight new high to turn their heads before it really gives up to the bear forces.

The Dow remains in a pattern which suggests the possibility of an Elliott contracting triangle. We won't know for sure until the pattern is complete. If it is a triangle, our tentative — and very much subject to revision — target for a final top is Tuesday afternoon at around 9150.

Historical Comparisons: the 1962 Crash
[ The following is the body of a Special Report we published Tuesday. If you're reading this in plain text format, please visit the website and click on the Special Report entitled
``The 1962 Stock Market Crash Analogy With 2002''. ]

We took a look at the 1962 Crash to see if might provide a model for this market. The 1962 chart looks like this:

As you can see, wave 3, the middle leg which saw the largest percentage decline take place, took 72 market days to unfold. The countertrend rally labeled wave 4 took just 43 days to retrace around 40% of the previous decline. It took a total of 87 days from the bottom of wave 3 for the market to put in its final low (wave 5).

We might consider using this crash sequence of waves as an analogy for this market (it may or may not be valid, of course). The countertrend wave 4 rally in 1962 took 59.72% of the time taken for the waterfall decline (wave 3) to unfold. In 2002, our wave 3 took just 48 days for the market to unravel from the May high. So far, the countertrend rally we have been experiencing since the 24th of July, and which we are counting as wave 4, has taken 24 days or 50% of the time taken in wave 3. To be exactly equal in time, percentage-wise, to the 1962 market analogy, wave 4 would be expected to last 28 or 29 trading days. That projection of a top in wave 4 targets Monday or Tuesday of next week for a top. Since the market is closed Monday, we'll call it this Friday or next Tuesday if this analogy with a prior market crash is valid. There are no guarantees. On the other hand, it does agree with the internal wave counts within the current rally. Anytime independent indicators agree bolsters the case for an accurate read on the market.

If the analogy does continue all the way into the wave 5 low, we would expect that final low of this leg of the secular bear market to finish on the 4th of October. The next leg up would then start a cyclical bull market of perhaps a year or more duration. Interestingly, that wave 5 low also coincides within a couple of weeks with our cyclic model's projection of a 2-year cycle landing (some folks call it a 4-year cycle while we prefer to look upon it as a basic 2-year cycle which is stronger every other revolution). That next bull market is likely to peak well below the peak of the last bull market due to the fact that we are probably going to remain in a secular bear market for at least another decade and due to the fact that the long term Federal Reserve interest rate cycle is peaking now and will be hard down in 2003-2004 as the Fed cranks rates up again.

Format for printing. [Go back]

For Tuesday, August 27, 2002
© Bob Carver
$-Weighted OEX/QQQ Call/Put Ratios: 0.92/0.32
Popular Indices: http://www.marketclues.net/cgi-bin/myclues?chart=/:/indices/d/_spx.4903.html&member=@@ ^SPX · http://www.marketclues.net/cgi-bin/myclues?chart=/:/indices/d/_compq.4903.html&member=@@ ^IXQ · http://www.marketclues.net/cgi-bin/myclues?chart=/:/indices/d/_ndx.4903.html&member=@@ ^NDX · http://www.marketclues.net/cgi-bin/myclues?chart=/:/indices/d/_dj.4903.html&member=@@ ^DJI · http://www.marketclues.net/cgi-bin/myclues?chart=/:/indices/d/_mid.4903.html&member=@@ ^MID · http://www.marketclues.net/cgi-bin/myclues?chart=/:/indices/d/_oex.4903.html&member=@@ ^OEX · http://www.marketclues.net/cgi-bin/myclues?chart=/:/indices/d/_nya.4903.html&member=@@ ^NYA · http://www.marketclues.net/cgi-bin/myclues?chart=/:/indices/d/_vle.4903.html&member=@@ ^VLE · http://www.marketclues.net/cgi-bin/myclues?chart=/:/indices/d/_rut.4903.html&member=@@ ^RUT · http://www.marketclues.net/cgi-bin/myclues?chart=/:/indices/d/_sml.4903.html&member=@@ ^SML · http://www.marketclues.net/cgi-bin/myclues?chart=/:/futures/d/cr_a0.4903.html&member=@@ ^CRB · http://www.marketclues.net/cgi-bin/myclues?chart=/:/indices/d/_xau.4903.html&member=@@ ^XAU · http://www.marketclues.net/cgi-bin/myclues?chart=/:/indices/d/_btk.4903.html&member=@@ ^BTK · http://www.marketclues.net/cgi-bin/myclues?chart=/:/indices/d/_tyx.4903.html&member=@@ ^TYX
Sector Performance Since: 8 Apr 1999 · 18 Oct 1999 · A Week Ago · A Fortnight Ago
Sector Acceleration Since: 8 Apr 1999 · 18 Oct 1999 · A Week Ago · A Fortnight Ago

MyClues Home Page Link ("http://clues.dhs.org:777/cgi-bin/myclues?myhome=yes&member;[email protected]")

http://www.elliottwave.com/a.asp?url=affiliates/ctc/081502ClubWelling.pdf&cn=mktclue In an interview with Kathryn Welling, Bob Prechter goes against the grain and discusses his perspective on bull vs. bear strategies, safe banks, the Fed and institutional investors. This interview is in Adobe Acrobat format. In order to view it you will need the most recent version of the Adobe Acrobat Reader. You can download this software, free of charge, from Adobe's Web Site.

Stocks: Sentiment Too Bearish

Monday's trading saw the market fall right into prior fourth wave support and rebound smartly. That's not surprising: often the market will find support at the prior fourth wave low.

Sentiment was well into the overly-bearish category with only 32¢ of QQQ calls (bets the NASDAQ-100 Index would rally) for each dollar of puts traded. Indeed, the NDX index once again provided ``lead-dog'' behavior by turning up and rallying ahead of the rest of the market. The OEX pit exhibited neutral sentiment with 92¢ into calls for each dollar of puts.

The turnaround in the correction which started with last Thursday's high rose on five-wave patterns, something we haven't seen in the market since early August. That's short term bullish and favors this being a wave 5 rally from the early August low. But, since the market rose on extremely light volume (barely a billion shares were traded on the NYSE), this rally could fail at any time. From a Time Ratio perspective, though, it could extend theoretically into Labor Day, 2 September. Since the market won't be open on Labor Day — it's a US holiday — that suggests the market will rally this week and form a high near the close on Friday.

Strangely enough, that's exactly what most traders are looking for: a rally this week and a selloff after Labor Day.

The S&P 500 Index was extremely weak during the first half of Monday's trading session, breaking below its uptrend support line on the daily chart. That break confirmed the bearish wedge pattern and the index should be weaker going forward. Although it should rally with the rest of the market, it is likely to fall hard once the fifth wave up completes late this week. It looks like there will be a good short selling opportunity on Friday for a position trade for a ride down to substantially lower lows than July's — it could be a 50% decline from here — in the next few months. Resistance is at the 50% and 62% retracements levels (9105 and 9475 on the Dow, 974.81 and 1021.82 on the SPX).

Home sales are booming according to the latest report. Can the real estate bubble pull the economy out of recession? Probably not, but it certainly can help temporarily. As long as mortgage rates continue lower, the stimulus from refinancing and home sales should help float the economy for several months. Eventually, however, there needs to be new jobs created and that doesn't look at all likely. Businesses are still laying off workers and have no plans to add new jobs this year. The downward deflationary spiral may appear to be defeated, but we suspect it's only a very temporary victory.

Format for printing. [Go back]

For Monday, August 26, 2002
© Bob Carver
$-Weighted OEX/QQQ Call/Put Ratios: 0.67/1.50
Popular Indices: http://www.marketclues.net/cgi-bin/myclues?chart=/:/indices/d/_spx.4903.html&member=@@ ^SPX · http://www.marketclues.net/cgi-bin/myclues?chart=/:/indices/d/_compq.4903.html&member=@@ ^IXQ · http://www.marketclues.net/cgi-bin/myclues?chart=/:/indices/d/_ndx.4903.html&member=@@ ^NDX · http://www.marketclues.net/cgi-bin/myclues?chart=/:/indices/d/_dj.4903.html&member=@@ ^DJI · http://www.marketclues.net/cgi-bin/myclues?chart=/:/indices/d/_mid.4903.html&member=@@ ^MID · http://www.marketclues.net/cgi-bin/myclues?chart=/:/indices/d/_oex.4903.html&member=@@ ^OEX · http://www.marketclues.net/cgi-bin/myclues?chart=/:/indices/d/_nya.4903.html&member=@@ ^NYA · http://www.marketclues.net/cgi-bin/myclues?chart=/:/indices/d/_vle.4903.html&member=@@ ^VLE · http://www.marketclues.net/cgi-bin/myclues?chart=/:/indices/d/_rut.4903.html&member=@@ ^RUT · http://www.marketclues.net/cgi-bin/myclues?chart=/:/indices/d/_sml.4903.html&member=@@ ^SML · http://www.marketclues.net/cgi-bin/myclues?chart=/:/futures/d/cr_a0.4903.html&member=@@ ^CRB · http://www.marketclues.net/cgi-bin/myclues?chart=/:/indices/d/_xau.4903.html&member=@@ ^XAU · http://www.marketclues.net/cgi-bin/myclues?chart=/:/indices/d/_btk.4903.html&member=@@ ^BTK · http://www.marketclues.net/cgi-bin/myclues?chart=/:/indices/d/_tyx.4903.html&member=@@ ^TYX
Sector Performance Since: 8 Apr 1999 · 18 Oct 1999 · A Week Ago · A Fortnight Ago
Sector Acceleration Since: 8 Apr 1999 · 18 Oct 1999 · A Week Ago · A Fortnight Ago

MyClues Home Page Link ("http://clues.dhs.org:777/cgi-bin/myclues?myhome=yes&member;[email protected]")

http://www.elliottwave.com/a.asp?url=affiliates/ctc/081502ClubWelling.pdf&cn=mktclue In an interview with Kathryn Welling, Bob Prechter goes against the grain and discusses his perspective on bull vs. bear strategies, safe banks, the Fed and institutional investors. This interview is in Adobe Acrobat format. In order to view it you will need the most recent version of the Adobe Acrobat Reader. You can download this software, free of charge, from Adobe's Web Site.

Stocks: Are We There Yet?

The chart below covers the SPX (S&P 500 Index) from just before the 1929 peak until Friday, 23 August 2002, in 3-month bars:

The top trendline connects the 1929 and 2000 peaks. The bottom trendline connects the 1942 and 1982 valley bottoms. These trendlines are virtually parallel to each other, indicating that the stock market has been moving within a long term channel for at least the last 73 years. The middle line was constructed by computing the midpoints between the top and bottom lines.

What can we learn from this chart?

First of all, we note that the market has spent much of its last 73 years below the middle of the channel. After falling from the 1929 peak through the middle of the channel to a price low in 1932, the market rallied from 1932 to 1937, then fell again under the bearish environment of the largest war mankind had ever conducted into the 1942 bottom. In the process it established the lower boundary of the channel. From 1942 until the end of the 'Sixties the market marched ever higher in the lower half of the channel toward that middle area. After the war ended in the mid-'Forties, the market trended higher, with that trend accelerating during the 'Fifties as it raced above the rate of growth of the channel itself. After reaching the mid-channel price area at the start of the 'Sixties, the market trended higher at about the same rate as the long term channel trend.

Things changed during the 'Seventies. The market trended sideways to down until it reached the price low of the 'Seventies in 1974 when it touched the lower channel line. Although we did not use the 1974 low in drawing the lower channel line (we actually used the low in 1982), the fact that the line also intersects the 1974 low confirms the validity of the line and the validity of the overall channel itself. The 'Seventies period of market decline corresponded to the War on Vietnam, which ultimately turned out to have been a big mistake for the US to have engaged in on moral, economic and military terms. Thus, you can see that, except for the 'Thirties, there was a close correlation between wars and stock market underperformance.

After the retest of the lower channel line in the early 'Eighties, the market zoomed up through the bottom half of the channel until it hit the middle channel line again in 1987, with the result a sharp pullback from the line once again, something that in hindsight is obvious considering the market's behavior during its prior experiences at exceeding that boundary. Despite the sharp pullback in stock prices, the result was a fairly brief but scary bear market, then prices continued higher, but still below the middle line until 1995 — notice how the early 'Nineties were a period where the market was hugging that line, building up momentum to surge above it.

After spending most of the preceding 64 years (from 1931 to 1995) below the line — there was a brief foray above the line in the 'Thirties — the breakout above the middle line was spectacular and the market zoomed to its 2000 ``date with destiny'' at the upper channel line. Once the surge came in 1995, the market shot higher as if from a cannon until it reached its 2000 peak.

It appears to us that the market's ``fair value'' is at the middle channel line. As you can see, periods when the market has attempted to move above that line from below have been rebuffed on most occasions — the line is clearly a resistance line. We can conclude that the middle line represents the natural growth rate of equities absent wars. Certainly, the periods above that line have been brief and have always been followed by retracements to and below the line, including our experience this year. Unfortunately, we have much market data which says the middle line acts as solid resistance when approached from underneath, but very little experience to say whether it is solid support when approached from above. In fact, the only similar experience is the 1929-1942 bear market where the line did not act as support on the way down. The bounce off the 1932 bottom did see the market go above the line once again, but it then failed to provide support on the subsequent retest. This year, we have the first example of the line actually providing some kind of support — the July low came in just below the line. The line was broken, however, which in technical analysis indicates it is very weak support and will fail on the next test. But, as we said, we have very few cases of this line acting as support.

So, are we there yet? No, but our best interpretation of this long term chart says we are halfway there. With a War on Iraq being planned out at the highest level of US government and the close correlation between wars and tests of the lower channel line, we cannot ignore history and expect a market which is clearly following a downward path to turn up on a permanent basis. Yes, we could see bounces (``cyclic bull markets'') go against the trend, but we always have to consider the long term trend in making investment decisions, knowing the market has the potential to fall an equal amount from current levels before finding ``permanent'' support at the lower channel line.

As of Friday's closing level of 940.87 on the SPX, the lower support line is at 370. Risk here is about 570 SPX points. The upper channel line is at 1782, about 840 points above the market. The middle line is at 813 — the SPX is 128 points above that potential — as yet unproven — support line.

The most probable path for the market is to repeat the 1929-1942 experience. The good news is that we are more than halfway there on the first leg down (analogous to the 1929-1932 ``Crash'') and have a cyclic bull market (analogous to the 1932-1937 bull move above the middle line) to look forward to. But, the third leg should be the one which carries the market to the bottom line and should correspond to a wartime environment, possibly on a global scale.

Where to Invest?
In this very dangerous bear market, stocks are the last place to invest — even gold stocks. Even the best stock-pickers are likely to lose money. However, those who bought stocks at the depths of the 1932 bear market made fortunes with those purchases. Thus, the primary goal for all investors should be to preserve capital now in order to have purchasing power at the bottom.

If stocks fall to the bottom area of the channel, investing could get even harder. For instance, what will the government do when tax revenues dry up and they are in danger of defaulting on their massive debt obligations? Will they declare any IRA or 401k investment ``too risky'' in instruments other than government debt? These are factors we will have to seriously consider if the market continues on its downward course through the middle trend line. These are also things Bob Prechter considers in his best-selling book Conquer the Crash (note that we do not receive a commission on sales of this book from referrals to it from this site — we provide this link as a service to our subscribers). So far, the denouement of the recent Bubble (which we may define as the period the market spent moving from the middle line to the upper line of the long term channel) has been consistent with everything Prechter has warned us about. In the last stock market fall into the bottom part of the long term channel, the US government made it illegal for investors to own gold. They confiscated gold from safety deposit boxes, turning banks into federal crime investigators. If you think a bank safety deposit box is a good place for valuables, you need to think again. And, read Prechter's book!

Short Term
The rally off the July-August lows appears to us to be either a wave 4 countertrend rally or — and this is where it gets really bearish — a wave 2 countertrend rally. The latter interpretation is bolstered by the price extent of the rally. We're closing in on a 50% retracement rally from the year's highs. That's typical of wave 2's, not 4's. If that more bearish count is correct, the wave 3 decline just ahead is likely to move the market (SPX) to the vicinity of 500 very quickly (once it gets started). That would be close to a 50% decline from current levels.
Very Short Term
The selloff on Friday was very weak, indicating it was mostly profit-taking, rather than the beginning of the next leg down. With volume dropping off sharply, the market may simply be working sideways in a trendless environment. Several individual stocks are showing Time Ratio turning points in early September, which may indicate the market will be caught in a trading range until that time. If so, the trading range would count as a wave 4 correction, with a wave 5 rally to follow to possibly 980-1000 on the SPX.

Australian All Ordinaries: http://www.marketclues.net/cgi-bin/myclues?chart=/:/indices/d/_aord.4903.html&member=wcorney@keatepartners.com

The All-Ords are slavishly following the US indices. Like the SPX and Dow, the index is within hailing distance of a 50% retracement of the preceding fall (the close Friday of 3133.4 was just below the 50% retracement price of 3176.7).
Australia Business News http://www.abc.net.au/news/business/default.htm
Yahoo! Australia Business News http://au.dailynews.yahoo.com/Full_Coverage/Australian_Economy/

London Financial-Times 100: http://www.marketclues.net/cgi-bin/myclues?chart=/:/indices/d/_ftse.4903.html&member=wcorney@keatepartners.com

The FTSE-100 has accomplished a 50% retracement of the preceding decline, which could be the end of the rally and the beginning of a wave 3 or C to the downside.

Bonds / Interest Rates: Contrary to Stocks, Still

As has been the case since the stock market Bubble top, bonds continue to move in opposite direction to stocks. At some point, and some observers think we've reached that point already, bonds are likely to head down along with stocks. For now, though, rallies in the bond market produce selloffs in stocks; profit-taking in bonds produce rallies in the stock market.

If the stock market falls below the middle long term trend line in the chart above, the bond market is likely to start worrying about the credit quality of the US government, sending Treasury rates higher, not lower.

Target 2030 Zero Coupon Bond Fund Quote

Euro Currency: http://www.marketclues.net/cgi-bin/myclues?chart=/:/futures/d/ec_a0.4903.html&member=wcorney@keatepartners.com

The downtrend continues in the Euro with a decline that has pushed the oscillator into oversold territory, but not as low as the prior oscillator low. This confirms the trend lower, but suggests the market may be on the verge of a rebound. Negative for the US Dollar Index.

U.S. Dollar Index: http://www.marketclues.net/cgi-bin/myclues?chart=/:/futures/d/dx_a0.4903.html&member=wcorney@keatepartners.com

Wave A (up) in the bear market rally may be in its final stages, pumped by the rebound in US stock prices. With stocks more likely to head lower than higher, this bear market rally in the currency could be ending soon.

Format for printing. [Go back]

For Friday, August 23, 2002
© Bob Carver
$-Weighted OEX/QQQ Call/Put Ratios: 0.95/1.26
Popular Indices: http://www.marketclues.net/cgi-bin/myclues?chart=/:/indices/d/_spx.4903.html&member=@@ ^SPX · http://www.marketclues.net/cgi-bin/myclues?chart=/:/indices/d/_compq.4903.html&member=@@ ^IXQ · http://www.marketclues.net/cgi-bin/myclues?chart=/:/indices/d/_ndx.4903.html&member=@@ ^NDX · http://www.marketclues.net/cgi-bin/myclues?chart=/:/indices/d/_dj.4903.html&member=@@ ^DJI · http://www.marketclues.net/cgi-bin/myclues?chart=/:/indices/d/_mid.4903.html&member=@@ ^MID · http://www.marketclues.net/cgi-bin/myclues?chart=/:/indices/d/_oex.4903.html&member=@@ ^OEX · http://www.marketclues.net/cgi-bin/myclues?chart=/:/indices/d/_nya.4903.html&member=@@ ^NYA · http://www.marketclues.net/cgi-bin/myclues?chart=/:/indices/d/_vle.4903.html&member=@@ ^VLE · http://www.marketclues.net/cgi-bin/myclues?chart=/:/indices/d/_rut.4903.html&member=@@ ^RUT · http://www.marketclues.net/cgi-bin/myclues?chart=/:/indices/d/_sml.4903.html&member=@@ ^SML · http://www.marketclues.net/cgi-bin/myclues?chart=/:/futures/d/cr_a0.4903.html&member=@@ ^CRB · http://www.marketclues.net/cgi-bin/myclues?chart=/:/indices/d/_xau.4903.html&member=@@ ^XAU · http://www.marketclues.net/cgi-bin/myclues?chart=/:/indices/d/_btk.4903.html&member=@@ ^BTK · http://www.marketclues.net/cgi-bin/myclues?chart=/:/indices/d/_tyx.4903.html&member=@@ ^TYX
Sector Performance Since: 8 Apr 1999 · 18 Oct 1999 · A Week Ago · A Fortnight Ago
Sector Acceleration Since: 8 Apr 1999 · 18 Oct 1999 · A Week Ago · A Fortnight Ago

MyClues Home Page Link ("http://clues.dhs.org:777/cgi-bin/myclues?myhome=yes&member;[email protected]")

In an interview with Kathryn Welling, Bob Prechter goes against the grain and discusses his perspective on bull vs. bear strategies, safe banks, the Fed and institutional investors. This interview is in Adobe Acrobat format. In order to view it you will need the most recent version of the Adobe Acrobat Reader. You can download this software, free of charge, from Adobe's Web Site.

Stocks: Waiting for a Top

We had hoped to be able to report that the bear market rally was over by now. However, as some of you have pointed out, the possibility exists that the market could levitate until after Labor Day. Thursday's action certainly supports that argument.

The NASDAQ-100 (NDX), our ``lead dog'' index, is likely to top out and turn down to tip off the move ahead of the Dow, S&Ps, etc. However, it remained relatively strong all day Thursday (even though the SOX index, a related index, did falter). Money Flow into NDX was relatively strong (as it has been lately), but we don't consider that a confirming indicator when it comes to the NASDAQ simply because it is very likely dominated by day-traders, rather than longer term investors. The related QQQ option indicator started out well into the overly-bullish camp as a large number of speculative call options were purchased in the morning. By afternoon, however, an equally large number of put options had been purchased. By the closing bell, calls and puts saw about the same amount of dollar volume: $1.26 went into calls (bets the rally would continue) for each dollar into puts (bets the rally would reverse to the downside). On the OEX, the standoff was even better. Thus, our leading sentiment indicator is only neutral here.

None of the indices have retraced a full 50% of their prior declines in this bear market rally even with Thursday's slight gains. That overhead resistance area looms large — and close at hand.

With resistance close overhead, what is the most likely course for the market here? We think that there are two strong alternatives to consider:

  1. The market enters a trading range that could carry it into next week or even into early September, then attempts a final rally. This alternative has a number of attractive arguments in its favor, including the fact that, without a wave 4 consolidation of some time, the current market advance can only be counted as a diagonal triangle in its wave C rally — a pattern which argues for a complete collapse from here to new lows. Such a collapse is likely to happen eventually, but we aren't seeing a lot of confirming indicators pointing to this — yet. If we did see such a catalyst as the War on Iraq break out, it would, very likely, send the market careening down the slopes once again. If the market does trace through a trading range, it would setup a final fifth wave rally to resistance and a major selling opportunity, possibly next week.

  2. If we have seen the top, even without an early warning from NDX, we should see the market turn down Friday morning. We should also see the bond market turn up and rally. This alternative would confirm the pattern as a diagonal triangle, an Elliott Wave structure which must be completely retraced to its base, or below.

The market is going to tip its hand shortly. A selloff which holds support in the vicinity of this week's lows would support the first alternative, a short term trading range, slightly higher high and then a correction to the downside. But, a big breakdown below this week's lows would confirm a short term, multi-thousand-point decline in the Dow. We won't have long to wait.

This weekend, we'll review the indicators to see if we can determine just where this market is likely to move from here. Hint: in an opinion survey report by a well-known pollster not yet released to the public, the investing public is confirmed to be quite bullish on buying stocks and that's a very big negative sentiment indicator if you're looking for an end to the bear market. We apparently have quite a long stretch of bear market to navigate still ahead.

Note: we had a power failure this evening and the website was down for about half an hour. It's back up now (18:44 ET Thursday), but the daily processing is going to be running about an hour behind schedule.

Format for printing. [Go back]

For Thursday, August 22, 2002
© Bob Carver
$-Weighted OEX/QQQ Call/Put Ratios: 0.56/6.26
Popular Indices: http://www.marketclues.net/cgi-bin/myclues?chart=/:/indices/d/_spx.4903.html&member=@@ ^SPX · http://www.marketclues.net/cgi-bin/myclues?chart=/:/indices/d/_compq.4903.html&member=@@ ^IXQ · http://www.marketclues.net/cgi-bin/myclues?chart=/:/indices/d/_ndx.4903.html&member=@@ ^NDX · http://www.marketclues.net/cgi-bin/myclues?chart=/:/indices/d/_dj.4903.html&member=@@ ^DJI · http://www.marketclues.net/cgi-bin/myclues?chart=/:/indices/d/_mid.4903.html&member=@@ ^MID · http://www.marketclues.net/cgi-bin/myclues?chart=/:/indices/d/_oex.4903.html&member=@@ ^OEX · http://www.marketclues.net/cgi-bin/myclues?chart=/:/indices/d/_nya.4903.html&member=@@ ^NYA · http://www.marketclues.net/cgi-bin/myclues?chart=/:/indices/d/_vle.4903.html&member=@@ ^VLE · http://www.marketclues.net/cgi-bin/myclues?chart=/:/indices/d/_rut.4903.html&member=@@ ^RUT · http://www.marketclues.net/cgi-bin/myclues?chart=/:/indices/d/_sml.4903.html&member=@@ ^SML · http://www.marketclues.net/cgi-bin/myclues?chart=/:/futures/d/cr_a0.4903.html&member=@@ ^CRB · http://www.marketclues.net/cgi-bin/myclues?chart=/:/indices/d/_xau.4903.html&member=@@ ^XAU · http://www.marketclues.net/cgi-bin/myclues?chart=/:/indices/d/_btk.4903.html&member=@@ ^BTK · http://www.marketclues.net/cgi-bin/myclues?chart=/:/indices/d/_tyx.4903.html&member=@@ ^TYX
Sector Performance Since: 8 Apr 1999 · 18 Oct 1999 · A Week Ago · A Fortnight Ago
Sector Acceleration Since: 8 Apr 1999 · 18 Oct 1999 · A Week Ago · A Fortnight Ago

MyClues Home Page Link ("http://clues.dhs.org:777/cgi-bin/myclues?myhome=yes&member;[email protected]")

Stocks: Nine Lives Market

This cat must be close to running out of lives, but still wants to push the boundaries on the upside. The NASDAQ-100 pushed to a new recovery high Wednesday, then fell back. A last minute rally tested the intraday high and provided a headline to attract more cash from the public to get ``into'' the rally.

We suggest the smart money still wants to sell some stock to the public. Our Money Flow figures reveal the truth underlying this market. For example, on the Value Line Index Daily Chart (with Money Flow), the money flow line actually peaked out on the 30th of July while the index itself has moved to a string of new recovery highs. The Value Line Index reflects the movement of the broad market better than any other indicator and thus serves as our proxy for market breadth indicators. As of the close Wednesday, the intraday high on the index of 1063.90 was within hailing distance of the prior 4th wave high of 1067.92, a place where we would expect the index to find solid resistance. Like the NASDAQ-100, we expect the broad market will peak before the blue chips.

Bubble-TV (CNBC), one of the media devices the smart money uses to levitate stock prices on wisps of hot air, does provide good information every so often. One of those rare occasions occured Wednesday afternoon when Art Cashin of UBS Paine-Webber reported that NYSE specialists were seeing buyers cancelling bids and sell stop orders building up on their books. This is an indication of things to come in our opinion: the floor falling away underneath the market. When the ``greater fools'' finish their buying of stock, prices will drop sharply lower. It's only a matter of time now.

The trading range that the Dow is tracing out could very well see the final peak extend into next week (we have a triangle apex that currently targets next Tuesday, subject to refinement as market action dictates), although the NASDAQ and broad market are likely to be well down once the blue chips hit their final peak. The intraday high on the S&P 500 Index for Wednesday was 951.59, just a few points below the ideal 50% retracement of the March-July decline at 974.81.

The 50% retracement level on the NYSE Index is 518.53. Wednesday's intraday high was 509.64.

NASDAQ-100 (NDX) has resistance from 1052 to 1064.30. We expect this index will top out first and head down even with the bluer chip indices still heading higher. The top in NDX could happen at any time now.

The Dow could accomplish a 50% retracement by rallying to 9105.

It's clear that we're very close to resistance — and very high above support — right now. It's a risky market, but given the media campaign to get investors to buy stocks, it may be early September at this rate before they lower the boom. Then, again, we could see the final high at any time now. Stay tuned.

Format for printing. [Go back]

For Wednesday, August 21, 2002
© Bob Carver
$-Weighted OEX/QQQ Call/Put Ratios: 1.37/1.08
Popular Indices: http://www.marketclues.net/cgi-bin/myclues?chart=/:/indices/d/_spx.4903.html&member=@@ ^SPX · http://www.marketclues.net/cgi-bin/myclues?chart=/:/indices/d/_compq.4903.html&member=@@ ^IXQ · http://www.marketclues.net/cgi-bin/myclues?chart=/:/indices/d/_ndx.4903.html&member=@@ ^NDX · http://www.marketclues.net/cgi-bin/myclues?chart=/:/indices/d/_dj.4903.html&member=@@ ^DJI · http://www.marketclues.net/cgi-bin/myclues?chart=/:/indices/d/_mid.4903.html&member=@@ ^MID · http://www.marketclues.net/cgi-bin/myclues?chart=/:/indices/d/_oex.4903.html&member=@@ ^OEX · http://www.marketclues.net/cgi-bin/myclues?chart=/:/indices/d/_nya.4903.html&member=@@ ^NYA · http://www.marketclues.net/cgi-bin/myclues?chart=/:/indices/d/_vle.4903.html&member=@@ ^VLE · http://www.marketclues.net/cgi-bin/myclues?chart=/:/indices/d/_rut.4903.html&member=@@ ^RUT · http://www.marketclues.net/cgi-bin/myclues?chart=/:/indices/d/_sml.4903.html&member=@@ ^SML · http://www.marketclues.net/cgi-bin/myclues?chart=/:/futures/d/cr_a0.4903.html&member=@@ ^CRB · http://www.marketclues.net/cgi-bin/myclues?chart=/:/indices/d/_xau.4903.html&member=@@ ^XAU · http://www.marketclues.net/cgi-bin/myclues?chart=/:/indices/d/_btk.4903.html&member=@@ ^BTK · http://www.marketclues.net/cgi-bin/myclues?chart=/:/indices/d/_tyx.4903.html&member=@@ ^TYX
Sector Performance Since: 8 Apr 1999 · 18 Oct 1999 · A Week Ago · A Fortnight Ago
Sector Acceleration Since: 8 Apr 1999 · 18 Oct 1999 · A Week Ago · A Fortnight Ago

MyClues Home Page Link ("http://clues.dhs.org:777/cgi-bin/myclues?myhome=yes&member;[email protected]")

Stocks: Bear Market Rally Running Out of Gas

The bear market rally we've seen since the morning of July 24th is clearly running out of gas now. Tuesday's ``correction'' wasn't abnormal: retracements are part of bull market rallies as well. And, the market found support right where it should have and attempted to rally back. Here's where there was a clear change in market character: the rally attempts just couldn't get up the hill. We're in rarified air here. The entire structure since the July low is playing out as an A-B-C wave pattern — a bearish corrective rally. Within the entire advance, the market has rallied in three-wave units, working its way higher in corrective patterns. This tells us that the larger bear trend is still alive and well. When this rally is finished — and it should be this week — the dominant trend will reassert itself to the downside.

Option traders were buying the dip as the OEX ratio ended with $1.37 going into calls for each dollar into puts. Intraday QQQ players were heavily buying calls all day, but the ratio dropped sharply toward neutral (1.08) at the close, probably due to put purchases (hedging activity) from some big players in the NASDAQ-100 stocks. This put buying at the close occured on a day when the final hour saw the ``smart money'' selling the market, another bearish sign (some people refer to the last hour of trading as indicative of the sentiment of the so-called ``smart money'').

The best short term Elliott interpretation we can give the Dow is that it is in a wave 4 correction which started after the close Monday. This wave 4 is part of a five-wave diagonal triangle upmove that constitutes wave C of that A-B-C pattern. That interpretation implies we will see wave 4 end soon, with a final wave 5 rally to close out the entire bear market rally and usher in a move to new lows. Unless the market can work sideways into next week, the C-wave will have taken the form of a very bearish diagonal triangle, a structure which is always completely retraced to its beginning point, or below. In this case, probability favors below that beginning point.

Short term, we should get a wave 4 low early Wednesday morning and the beginning of that wave 5 rally. We could be wrong. Things could be more bearish than we have outlined: the high Monday could have been the final high of the bear market rally and we may already be in the next bear wave to the downside. If so, we didn't get the normal advanced warning from the NASDAQ-100 we're used to getting. Typically, that index will turn down a couple of days before the Dow. That's why our preferred count is of a wave 4 of 5 waves up in wave C, rather than something more bearish.

Our best working estimate for a wave 5 high is Thursday near the close. That will be refined as we work toward that timeframe. We are cautious here: even the trading moves are weakening as the market builds an intermediate top and prepares to resume the bear trend down to SPX 700 and Dow 6600. Those trading cycles which have provided the uplift under this rally are rolling over and dropping down, leaving fewer and fewer cycles to push stocks up the mountain. If we do get the high this week, the 22-week trading cycle will have topped only 4 weeks into the cycle, with approximately 18 weeks to go to the nominal cycle low. That extreme left translation (where the peak of the cycle occurs far the ``left'' of the midpoint in the cycle) indicates the net effect of longer term cycles is hard down.

Format for printing. [Go back]

For Tuesday, August 20, 2002
© Bob Carver
$-Weighted OEX/QQQ Call/Put Ratios: 1.10/2.87
Popular Indices: http://www.marketclues.net/cgi-bin/myclues?chart=/:/indices/d/_spx.4903.html&member=@@ ^SPX · http://www.marketclues.net/cgi-bin/myclues?chart=/:/indices/d/_compq.4903.html&member=@@ ^IXQ · http://www.marketclues.net/cgi-bin/myclues?chart=/:/indices/d/_ndx.4903.html&member=@@ ^NDX · http://www.marketclues.net/cgi-bin/myclues?chart=/:/indices/d/_dj.4903.html&member=@@ ^DJI · http://www.marketclues.net/cgi-bin/myclues?chart=/:/indices/d/_mid.4903.html&member=@@ ^MID · http://www.marketclues.net/cgi-bin/myclues?chart=/:/indices/d/_oex.4903.html&member=@@ ^OEX · http://www.marketclues.net/cgi-bin/myclues?chart=/:/indices/d/_nya.4903.html&member=@@ ^NYA · http://www.marketclues.net/cgi-bin/myclues?chart=/:/indices/d/_vle.4903.html&member=@@ ^VLE · http://www.marketclues.net/cgi-bin/myclues?chart=/:/indices/d/_rut.4903.html&member=@@ ^RUT · http://www.marketclues.net/cgi-bin/myclues?chart=/:/indices/d/_sml.4903.html&member=@@ ^SML · http://www.marketclues.net/cgi-bin/myclues?chart=/:/futures/d/cr_a0.4903.html&member=@@ ^CRB · http://www.marketclues.net/cgi-bin/myclues?chart=/:/indices/d/_xau.4903.html&member=@@ ^XAU · http://www.marketclues.net/cgi-bin/myclues?chart=/:/indices/d/_btk.4903.html&member=@@ ^BTK · http://www.marketclues.net/cgi-bin/myclues?chart=/:/indices/d/_tyx.4903.html&member=@@ ^TYX
Sector Performance Since: 8 Apr 1999 · 18 Oct 1999 · A Week Ago · A Fortnight Ago
Sector Acceleration Since: 8 Apr 1999 · 18 Oct 1999 · A Week Ago · A Fortnight Ago

MyClues Home Page Link ("http://clues.dhs.org:777/cgi-bin/myclues?myhome=yes&member;[email protected]")

Stocks: Lemmings Rushing to the Cliff

The stock market rallied Monday as investors emulated lemmings in a suicidal rush to the cliff. Even the news of retail sales disappointments and a Leading Economic Indicator which confirmed the deepening recession wasn't enough to stop the stock price rise. Money Flow diverged bearishly against new recovery highs as the rally exceeded our low expectations.

All this doesn't mean it's all over for the stock market and that a crash is directly ahead. But, it certainly improves the odds that a crash is in our future. It's the end result of Darvas' advice: the dancer dips to gain momentum, then leaps, and finally falls back to earth. The dip from May to July created a deeply oversold condition which resulted in a leap skyward. But, without sprouting wings, this dancer is destined to fall to earth again.

What is pushing stocks higher? The bond market is. The bond market's big gains last week have led to a correction and profit-taking. Those funds are flowing into the stock market. The bond market correction is over, or close to over now, so we should expect that source of funds will be drying up very soon.

We didn't short sell the Dow Monday. We have a very strict set of rules for entering trading positions and we had two of those rules which precluded selling:

  1. The NASDAQ-100 was leading higher. We use this index as a leading indicator for the market. It must show relative weakness before selling.

  2. Sentiment was cautious on the OEX Dollar-Weighted Call-Put indicator. We would like to see higher levels of bullishness before selling.

The wedge-shaped ascent in the NDX Chart (NASDAQ-100) tells us this rally is the final wave up from the early August bottom. The NASDAQ is rising on fumes and hope. Still, we won't sell short until this indicator shows a definite breakdown relative to the rest of the market.

VIX
We read an interesting emailed article from Bernie Shaeffer Monday morning which piqued our interest. The article explained the difference between the VIX (CBOE Volatility Indicator) and real volatility. VIX is based upon speculators' willingness to pay time premium on options, while true volatility is based upon actual price excursions. The article noted that since the July 24th bottom, VIX has dropped more sharply than real volatility. In other words, speculators got bullish very quickly after the July 24th low — more bullish than history says they should be. The very same pattern occured in 1998 at the double bottom — just after the first low. And, as you might have guessed, the market made a lower low very soon thereafter. This is more evidence that the current rally is drawing in the suckers before the boom is lowered on them.

Format for printing. [Go back]

For Monday, August 19, 2002
© Bob Carver
$-Weighted OEX/QQQ Call/Put Ratios: 2.15/6.90
Popular Indices: http://www.marketclues.net/cgi-bin/myclues?chart=/:/indices/d/_spx.4903.html&member=@@ ^SPX · http://www.marketclues.net/cgi-bin/myclues?chart=/:/indices/d/_compq.4903.html&member=@@ ^IXQ · http://www.marketclues.net/cgi-bin/myclues?chart=/:/indices/d/_ndx.4903.html&member=@@ ^NDX · http://www.marketclues.net/cgi-bin/myclues?chart=/:/indices/d/_dj.4903.html&member=@@ ^DJI · http://www.marketclues.net/cgi-bin/myclues?chart=/:/indices/d/_mid.4903.html&member=@@ ^MID · http://www.marketclues.net/cgi-bin/myclues?chart=/:/indices/d/_oex.4903.html&member=@@ ^OEX · http://www.marketclues.net/cgi-bin/myclues?chart=/:/indices/d/_nya.4903.html&member=@@ ^NYA · http://www.marketclues.net/cgi-bin/myclues?chart=/:/indices/d/_vle.4903.html&member=@@ ^VLE · http://www.marketclues.net/cgi-bin/myclues?chart=/:/indices/d/_rut.4903.html&member=@@ ^RUT · http://www.marketclues.net/cgi-bin/myclues?chart=/:/indices/d/_sml.4903.html&member=@@ ^SML · http://www.marketclues.net/cgi-bin/myclues?chart=/:/futures/d/cr_a0.4903.html&member=@@ ^CRB · http://www.marketclues.net/cgi-bin/myclues?chart=/:/indices/d/_xau.4903.html&member=@@ ^XAU · http://www.marketclues.net/cgi-bin/myclues?chart=/:/indices/d/_btk.4903.html&member=@@ ^BTK · http://www.marketclues.net/cgi-bin/myclues?chart=/:/indices/d/_tyx.4903.html&member=@@ ^TYX
Sector Performance Since: 8 Apr 1999 · 18 Oct 1999 · A Week Ago · A Fortnight Ago
Sector Acceleration Since: 8 Apr 1999 · 18 Oct 1999 · A Week Ago · A Fortnight Ago

MyClues Home Page Link ("http://clues.dhs.org:777/cgi-bin/myclues?myhome=yes&member;[email protected]")

Rumblings in the Gold Market By Ron Taylor

Stocks: Bullishness Warns of a Top

Last week, the stock market did its best to convince the crowd that the July low was a real bottom. And it appears the bear has done his job well: OEX players spent $148,299,800 on bets the market rally would continue and only $85,450,700 on bets the bear market would continue. That's a ratio of 1.74 of call-dollars to put-dollars for the week as a whole. But, the last three days of the week saw the individual days' ratios all into the overly-bullish camp as the market snapped back from the Tuesday afternoon plunge on the mistake the Fed made in not cutting short term rates. Ratios over 2.0 are in the overly-bullish category and are a fairly reliable indicator of a stock market top in the making. During bull markets, though, those overly-bullish readings tend to occur about a week before the market actually makes its highest high. And, we may very well have a similar relationship at work right now as the market has continued to make higher highs since that first jump into the overly-bullish category which occured on Wednesday.

Although the stock market didn't approve of the ineptitude of the Federal Reserve last week and sold off sharply on Tuesday afternoon as it sensed the economy was in danger of sinking further, the bond market vigilantes decided to take matters into their own hands and to lower longer term rates to help make up for that error. Treasury bond and note prices soared, sending longer term interest rates plunging to 64-year lows. Rates then started to rise again as bond market players took profits on their quick capital gains. It was those profits in bonds which flowed into the stock market and which led to the bounceback rally that got started Wednesday. In other words, the bond market saw the economy continuing to slide as the recession deepens in the face of Federal Reserve inaction, leading to a bond market rally. Profit-taking in bonds sent stocks to new recovery highs. Did we ever claim the stock market was logical? Understandable sometimes, but not very logical. This is one graphic example of how bad news can send stock prices up. It's also an example of how the bond market can act as a governor on the Federal Reserve to help ameliorate the latter's policy errors. Fortunately, such jumps in stock prices as we saw last week are not sustainable — if the economy continues to slide deeper into recession, as we believe it will; stock price rises here will be corrected as soon as the flow of funds from bonds is cut off on the next bond rally. A lower low in stock prices than July 24 is very likely. After all, a rise in stock prices in the face of a declining economy just sets the market up for a crash in the future — as we're sure you found out in the aftermath of the ``Bubble of the 'Nineties'': the current bear market — which we might term the ``Hangover of the 'Naughties'' — is undeniably due to the excesses of the stock price runup in the preceding decade.

The question is whether or not the economy can grow from here based upon mortgage refinancing and home sales due to lower long term interest rates. We have grave doubts that the real estate sector by itself will power the economy into an expansion without help from business investment and new jobs, both of which are notably lacking in the present environment. The bond market can help, but not totally cure, some of the problems caused by a Fed that's too tight with interest rates — real interest rates are high when deflation factors into the equation. For a good chart and article showing how interest rates in the US are closely paralleling Japan's experience over the past 40 years, see the article, Deflation Worries On The Increase: Policy U-Turn Ahead on the Bank Credit Analyst website. That article points out:

``This week's BCA Global Investment Strategy bulletin highlights that inflation is now close to zero in the U.S. and Europe and it is worrisome that the global economy is showing signs of stumbling, undermined by the excesses of the late-1990s and the resulting meltdown in equity and corporate bond prices. The lesson from Japan (and the 1930s) is to avoid deflation at all costs, underscoring that policies will soon need to relax if economic activity continues to slow.''

We think it's going to take action from both the fiscal and monetary authorities to turn this economy up out of recession. So far, we've gotten some stimulus from the US government, which is running a large deficit partially due to increased spending. But, most of the deficit is actually caused by the reduction in tax revenue due to the fall in the stock market, so the stimulative effects of the deficit may be neutralized by those same falling stock prices. If the Fed doesn't get its act together soon, it may find itself ``pushing on a string'' — i.e., unable to stimulate the economy with even 0% interest rates. At that point, they would have to invoke their seldom used policy tools or ask Congress for new ones, such as a ``Money Rain'' — i.e., free money — whereby the Fed would ``rain'' cash on individuals and corporations to generate spending to get the economy moving again. Certainly, we're not anywhere close to such a crisis yet, but the fact that the Fed is seriously discussing such possibilities tells us they will pull out all stops to keep the country from dropping into a Japanese-style deflationary depression. If you've been reading and hearing analysts saying the Fed doesn't want to ``use up all its bullets'' on interest rate cuts, what they aren't aware of is that the Fed has more tools up its sleeve should they lower rates to zero and find the economy still foundering.

How low can stock prices fall?
We took another look at the longer term picture (see the Weekly S&P 500 Cash Index Chart for details). We have noted before that the July low fell toward, and found support near, a former resistance line formed from the 1987 and 1994 highs (it's the dark green line in the chart). Trendline analysis tells us to expect that a former resistance line should provide support when the market comes down to it again. Indeed, that was the case this time. That provides us with some reassurance, but there is another line which might provide more substantial support. That other line is drawn in light green and connects the lows of 1991 and 1994 — it almost parallels the dark green line. It is a support line which has never been broken. In fact, it is our preferred line for providing a low in this current bear market. That line will come in around the 700 level in the S&P 500 in the September-October timeframe. If we do get a top in the bear market rally this week as we expect to, the next low target using Time Ratios suggests a late September low. And, if that low occurs on that light green support line, the S&P 500 should bottom in the vicinity of 700. If the actual low comes later, the price low could be a bit higher, but not much: that line is rising at less than one point per day.

The 700 level on the S&P 500 Index corresponds to about 6615 on the Dow Jones Industrial Average. In other words, the risk here is 2162 Dow points based upon Friday's close of 8778. We are estimating the upside potential for a rally this week to be limited to about 8922, so the reward potential is about 144 Dow points, or 1.64%. Bottom Line: with a reward/risk ratio of only 0.0666, we see no reason to chase this rally on an investment basis. On a trading basis, we will probably take that risk with a close protective sell stop order to reverse position — but only if we see the short term indicators lined up to maximize the chances of making money.

Euro Currency: http://www.marketclues.net/cgi-bin/myclues?chart=/:/futures/d/ec_a0.4903.html&member=wcorney@keatepartners.com

The Euro has rallied back into the area of the prior 4th wave and has formed a topping pattern there. In addition, a 50% retracement of the initial leg down was encountered at 0.9872 on the September contract. It's very likely this rally is over and a second leg down directly ahead.

U.S. Dollar Index: http://www.marketclues.net/cgi-bin/myclues?chart=/:/futures/d/dx_a0.4903.html&member=wcorney@keatepartners.com

The Dollar Index dipped (on the cash chart) slightly below the 50% retrement level of 106.27 on Wednesday (the low was 106.18), but found support and rallied somewhat since then. We should have another rally directly ahead in this bear market. Risk is for a retest of the lows when the stock market selloff gets momentum to the downside. We do expect the lows to hold for a larger-degree rally carrying the Dollar Index to a substantial retracement of its losses this year. That larger-degree rally is not likely to occur until we get a bottom in the stock market, however.

Australian All Ordinaries: http://www.marketclues.net/cgi-bin/myclues?chart=/:/indices/d/_aord.4903.html&member=wcorney@keatepartners.com

The All-Ords broke below the long term uptrend line four weeks ago — confirming the secular bear trend has affected Australia's economy as well — and has been bouncing back in this bear market rally. It has now come back to the old long term support line which should now act as resistance to further rally. A retest of last September's lows, or possibly somewhat lower, is directly ahead.
Australia Business News http://www.abc.net.au/news/business/default.htm
Yahoo! Australia Business News http://au.dailynews.yahoo.com/Full_Coverage/Australian_Economy/

London Financial-Times 100: http://www.marketclues.net/cgi-bin/myclues?chart=/:/indices/d/_ftse.4903.html&member=wcorney@keatepartners.com

The London market endured a long contracting triangle trading range from October 2001 to late May 2002, then dropped sharply in a thrust move to the downside. Since it made an intermediate low on the 24th of July, the index has retraced almost half of the thrust decline. This puts the index in an area of strong resistance. Since the apex of the contracting triangle, often a good estimate for when the thrust out of the triangle will reverse course, occurs on the 5th-6th of September, we suggest that the next leg down will put in the final low of this decline. After that, we could easily get a vigorous recovery rally. Until then, great caution is wise for stock investors.

Bonds / Interest Rates:

As described above, the bond market rallied on lack of a rate cut from the Fed, then sold off on profit-taking. With stocks likely to be weak into September-October, we could get another bond rally coincident with the stock market decline.

The next rally in the bond market is likely to be the last one and usher in a bear market in bonds. This will be good news for stocks because the bond market has been a sponge, soaking up investment capital that could have gone into the stock market. Once investors realize the bond market is in a bear market, they will sell bonds and buy stocks for a vigorous bull market later this year.

Target 2030 Zero Coupon Bond Fund Quote

Sectors and Individual Stocks (Subscribers Only)

For tables ranking sectors and individual stocks, and links to charts of 3500 individual stocks and sectors, please visit your very own MyClues Home Page[http://www.marketclues.net/cgi-bin/myclues?myhome=yes&member=@@] -- in the CHARTS & RESEARCH section of the page, you will find a wealth of tools for selecting top sectors and stocks, including access to our exclusive realtime, intraday indicators.

For a 3-4 month free trial subscription, click here.

Commodities (Subscribers Only)

For complete charts of commodities, please visit your very own MyClues Home Page[http://www.marketclues.net/cgi-bin/myclues?myhome=yes&member=@@] -- in the CHARTS & RESEARCH section of the page, you will find links to webpages containing links to the following:

For a 3-4 month free trial subscription, click here.

CRB Index: http://www.marketclues.net/cgi-bin/myclues?chart=/:/futures/d/cr_a0.4903.html&member=wcorney@keatepartners.com

Commodity prices are rising on the back of weather problems in the grain-producing areas of the world (at least, the Northern Hemisphere — the Southern Hemisphere is in winter now) and anticipation of the War on Iraq that's about to break out.

Format for printing. [Go back]

For Friday, August 16, 2002
© Bob Carver
$-Weighted OEX/QQQ Call/Put Ratios: 3.04/9.34
Popular Indices: http://www.marketclues.net/cgi-bin/myclues?chart=/:/indices/d/_spx.4903.html&member=@@ ^SPX · http://www.marketclues.net/cgi-bin/myclues?chart=/:/indices/d/_compq.4903.html&member=@@ ^IXQ · http://www.marketclues.net/cgi-bin/myclues?chart=/:/indices/d/_ndx.4903.html&member=@@ ^NDX · http://www.marketclues.net/cgi-bin/myclues?chart=/:/indices/d/_dj.4903.html&member=@@ ^DJI · http://www.marketclues.net/cgi-bin/myclues?chart=/:/indices/d/_mid.4903.html&member=@@ ^MID · http://www.marketclues.net/cgi-bin/myclues?chart=/:/indices/d/_oex.4903.html&member=@@ ^OEX · http://www.marketclues.net/cgi-bin/myclues?chart=/:/indices/d/_nya.4903.html&member=@@ ^NYA · http://www.marketclues.net/cgi-bin/myclues?chart=/:/indices/d/_vle.4903.html&member=@@ ^VLE · http://www.marketclues.net/cgi-bin/myclues?chart=/:/indices/d/_rut.4903.html&member=@@ ^RUT · http://www.marketclues.net/cgi-bin/myclues?chart=/:/indices/d/_sml.4903.html&member=@@ ^SML · http://www.marketclues.net/cgi-bin/myclues?chart=/:/futures/d/cr_a0.4903.html&member=@@ ^CRB · http://www.marketclues.net/cgi-bin/myclues?chart=/:/indices/d/_xau.4903.html&member=@@ ^XAU · http://www.marketclues.net/cgi-bin/myclues?chart=/:/indices/d/_btk.4903.html&member=@@ ^BTK · http://www.marketclues.net/cgi-bin/myclues?chart=/:/indices/d/_tyx.4903.html&member=@@ ^TYX
Sector Performance Since: 8 Apr 1999 · 18 Oct 1999 · A Week Ago · A Fortnight Ago
Sector Acceleration Since: 8 Apr 1999 · 18 Oct 1999 · A Week Ago · A Fortnight Ago

MyClues Home Page Link ("http://clues.dhs.org:777/cgi-bin/myclues?myhome=yes&member;[email protected]")

Stocks: Market Consolidates Near Recovery Highs

After the big surge higher Wednesday, the market spent Thursday trying to find direction, consolidating sideways in what is likely a next-to-last wave sideways before a short term rally into a top. The market has certainly shown the fabled tendency of cats: that is, it seems to have nine lives. Each time it looks like the herky-jerky rally is done for, it pulls another life out of the hat and frustrates the bears with a rousing jump. There are substantial resistance areas directly overhead, though (for details, see our Trading Page comments and the quarter-hourly S&P 500, NASDAQ-100 and Dow Industrials charts for Fibonacci resistance areas).

But, those lives may be running out for this cat. The current leg up is very likely the final one. We've been approaching this market on a day-trading basis lately while preserving longer term investment cash for a time when the market appears likely to trend. So far, that has been the best way to navigate the twists and turns. The surge in our sentiment gauges well into the overly-bullish category Thursday is a strong warning signal that the market is getting deliriously happy (OEX players bet $3.04 that the market would continue rallying for every dollar they bet it wouldn't, while the QQQ traders went hog-wild, betting $9.34 on the continuance of the rally for each dollar bet on the downside). There's nothing wrong with being happy, of course, but this level of bullishness is downright giddy.

We will be looking for the market to form another short term top over the next couple of trading days. If, on the next selloff, players continue to prefer calls to puts, we'll have a strong sign that the bear market rally is over and that we're on our way to plumb the depths again. Until then, we'll continue to look for intraday trades and, in general, move to the sidelines by the close.

For Friday, it appears we could see just a bit more rally, then a move down to test the bottom of the trading range. We're now extremely overbought on this bear market rally and a big move to the downside appears to be very close in time. In any case, the risk greatly outweighs the potential rewards, except for short term trades. You can follow our intraday trading comments on the Trading Page, linked from your MyClues Page.

Format for printing. [Go back]

For Thursday, August 15, 2002
© Bob Carver
$-Weighted OEX/QQQ Call/Put Ratios: 2.24/2.76
Popular Indices: http://www.marketclues.net/cgi-bin/myclues?chart=/:/indices/d/_spx.4903.html&member=@@ ^SPX · http://www.marketclues.net/cgi-bin/myclues?chart=/:/indices/d/_compq.4903.html&member=@@ ^IXQ · http://www.marketclues.net/cgi-bin/myclues?chart=/:/indices/d/_ndx.4903.html&member=@@ ^NDX · http://www.marketclues.net/cgi-bin/myclues?chart=/:/indices/d/_dj.4903.html&member=@@ ^DJI · http://www.marketclues.net/cgi-bin/myclues?chart=/:/indices/d/_mid.4903.html&member=@@ ^MID · http://www.marketclues.net/cgi-bin/myclues?chart=/:/indices/d/_oex.4903.html&member=@@ ^OEX · http://www.marketclues.net/cgi-bin/myclues?chart=/:/indices/d/_nya.4903.html&member=@@ ^NYA · http://www.marketclues.net/cgi-bin/myclues?chart=/:/indices/d/_vle.4903.html&member=@@ ^VLE · http://www.marketclues.net/cgi-bin/myclues?chart=/:/indices/d/_rut.4903.html&member=@@ ^RUT · http://www.marketclues.net/cgi-bin/myclues?chart=/:/indices/d/_sml.4903.html&member=@@ ^SML · http://www.marketclues.net/cgi-bin/myclues?chart=/:/futures/d/cr_a0.4903.html&member=@@ ^CRB · http://www.marketclues.net/cgi-bin/myclues?chart=/:/indices/d/_xau.4903.html&member=@@ ^XAU · http://www.marketclues.net/cgi-bin/myclues?chart=/:/indices/d/_btk.4903.html&member=@@ ^BTK · http://www.marketclues.net/cgi-bin/myclues?chart=/:/indices/d/_tyx.4903.html&member=@@ ^TYX
Sector Performance Since: 8 Apr 1999 · 18 Oct 1999 · A Week Ago · A Fortnight Ago
Sector Acceleration Since: 8 Apr 1999 · 18 Oct 1999 · A Week Ago · A Fortnight Ago

MyClues Home Page Link ("http://clues.dhs.org:777/cgi-bin/myclues?myhome=yes&member;[email protected]")

Stocks: Lessons in Market Supply and Demand

Wednesday was a very interesting day in the markets as it presented a graphic example of supply and demand pressures which can move the market sharply higher. And, it all started when the Fed announced on Tuesday afternoon they weren't going to lower short term interest rates but saw weakness in the economy as a danger. That remark sent money flowing into the bond markets, sending 10-year Treasury Note rates — see the
TNX chart for a look at 10-year Note rates — plummeting (bond rates move exactly opposite bond prices: a rise in the bond market means that rates are falling). Money flowed out of the stock market, sending stock market indices tumbling all the way into Wednesday morning and into a consolidation trading range in early afternoon.

However, the drop in longer term rates due to demand for bonds and notes created a situation where the 10-year note rate dropped below 4% (and a better than 60-year low). This low rate created a situation where money managers who had invested in bonds and notes saw extremely large paper profits. Moreover, they saw that lower long term rates would help stimulate demand from the consumer via mortgage refinancing activity — the real estate bubble just got bigger. And, they decided that a reallocation of funds from bonds to stocks made sense. They sold bonds and plowed that money right into the stock market, buying almost everything in sight Wednesday afternoon. This created a short covering panic, sending the NASDAQ-100 and the S&P 500 futures soaring into new relative high ground (the Dow Industrials, however, stalled at a resistance line somewhat below its prior highs, creating something of a bearish divergence against those other indices itself).

While some of the Bubble-TV folks seemed to think the SEC deadline for certifying company accounting reports had something to do with the rally, we think that's an awful stretch of the imagination. What happened was pure old supply and demand pressure. No Plunge Protection Team needed, thanks anyway. And, the action Tuesday and Wednesday of this week are excellent examples of why investors should be safely in cash: it's a short term, intraday trading environment in both stocks and bonds.

What to expect on Thursday? Well, if we had to guess, we'd expect the bond rally might have a bit more life left in it. If bond rates go down to test Wednesday's lows, it could provide enough pressure to send stocks tumbling back in a retracement of the rally, but no guarantees in this market. Sentiment argues that we are going to have a retracement as both the OEX and QQQ data jumped into overly-bullish mode (i.e., when there is more than twice as much money being bet on the rally continuing, we call it overly-bullish).

Once the bond market rally does top out, however, the stock market could very well rally strongly. A good bond market top and tumble down the hill would be a signal for stock investors to get back into the pool. With interest rates this low, a top in bonds could occur at any time, so it pays to watch the bond market for a turn.

At this point in time in the markets, it pays to watch several markets and their interplay: the bond market, the stock market and the US dollar being the key ones.

Format for printing. [Go back]

For Wednesday, August 14, 2002
© Bob Carver
$-Weighted OEX/QQQ Call/Put Ratios: 0.83/0.84
Popular Indices: http://www.marketclues.net/cgi-bin/myclues?chart=/:/indices/d/_spx.4903.html&member=@@ ^SPX · http://www.marketclues.net/cgi-bin/myclues?chart=/:/indices/d/_compq.4903.html&member=@@ ^IXQ · http://www.marketclues.net/cgi-bin/myclues?chart=/:/indices/d/_ndx.4903.html&member=@@ ^NDX · http://www.marketclues.net/cgi-bin/myclues?chart=/:/indices/d/_dj.4903.html&member=@@ ^DJI · http://www.marketclues.net/cgi-bin/myclues?chart=/:/indices/d/_mid.4903.html&member=@@ ^MID · http://www.marketclues.net/cgi-bin/myclues?chart=/:/indices/d/_oex.4903.html&member=@@ ^OEX · http://www.marketclues.net/cgi-bin/myclues?chart=/:/indices/d/_nya.4903.html&member=@@ ^NYA · http://www.marketclues.net/cgi-bin/myclues?chart=/:/indices/d/_vle.4903.html&member=@@ ^VLE · http://www.marketclues.net/cgi-bin/myclues?chart=/:/indices/d/_rut.4903.html&member=@@ ^RUT · http://www.marketclues.net/cgi-bin/myclues?chart=/:/indices/d/_sml.4903.html&member=@@ ^SML · http://www.marketclues.net/cgi-bin/myclues?chart=/:/futures/d/cr_a0.4903.html&member=@@ ^CRB · http://www.marketclues.net/cgi-bin/myclues?chart=/:/indices/d/_xau.4903.html&member=@@ ^XAU · http://www.marketclues.net/cgi-bin/myclues?chart=/:/indices/d/_btk.4903.html&member=@@ ^BTK · http://www.marketclues.net/cgi-bin/myclues?chart=/:/indices/d/_tyx.4903.html&member=@@ ^TYX
Sector Performance Since: 8 Apr 1999 · 18 Oct 1999 · A Week Ago · A Fortnight Ago
Sector Acceleration Since: 8 Apr 1999 · 18 Oct 1999 · A Week Ago · A Fortnight Ago

MyClues Home Page Link ("http://clues.dhs.org:777/cgi-bin/myclues?myhome=yes&member;[email protected]")

Stocks: The Fed Just Doesn't Get It

The Federal Open Market Committee (FOMC) voted to keep interest rates stable at their meeting Tuesday, proving once again that Greenspan & Co. don't know how to deal with an economy caught in the grip of deflation. After the decision, interest rates on longer term issues the Fed doesn't control dropped sharply lower, with the 2-year Treasury Note falling below the overnight Federal Funds rate. That's a clear vote of no-confidence in the Fed's ability to stimulate the economy out of this second leg of the recession. When creditors expect less interest for loaning money for 730 days than they could expect to get loaning them to a bank overnight, you just have to conclude that the FOMC needs to be replaced with an agency which ``gets it''.

We're not the only ones with that opinion, of course. But, you won't hear it from anyone in the Bush Administration: apparently, they think Alan Greenspan is God when it comes to monetary policy. However, Bubble-TV's Larry Kudlow's reaction was absolutely correct: ``Dumbest decision the Fed could have made.''

While the bond market figured out the implication immediately and rallied, the stock market didn't know what to make of the decision. It gyrated wildly within the narrow trading range it had held to all day Tuesday. But, then, after the bond market closed, it dawned on the stock boys and girls that the Fed had committed to a path that would see the economy continuing to slide further into the hole it had been digging for itself for the past two years — with no end in sight to the recession/depression. The reality is, specifically:

  1. An economy that never emerged from the recession which started in 2000;

  2. An economy that is sinking again — and quickly this time;

  3. A clueless Federal Reserve that is blinded by fear of future inflation while unable to recognize the deflationary forces that have a death grip on the economy.

NASDAQ had been strong earlier in the session, but the Fed announcement caused a fifth wave rally to fail and the market plummeted through support.

Earlier in the day, the stock market (Dow and S&Ps) had been working on a contracting triangle, which would have eventually seen a rally out to a new high. However, taking its cue from the bond market after it closed and the NASDAQ, the sellers hit stocks hard, sending the market over the cliff. The counter-trend rally was over and the next leg down in the bear market has begun. Next stop: new lows. It will be interesting to see whether support in the Dow in the 7400s will hold.

It's now clear that this recession is going to drag on much longer than almost anyone wanted it to. And, that means a very rough campaign season for the Republicans this year as they fight off mounting charges that they have done virtually nothing to stimulate the economy out of the recession. It's beginning to look a lot like Hoover's Administration (1930's) all over again as Bush and O'Niell (Treasury Secretary) mouth words of confidence in the soundness of the economy as it sinks further into the quicksand of deflation. One wonders who will play the role of Franklin D. Roosevelt in this remake?

Our investment position is cash. On a trading basis, we are selling rallies short.

Format for printing. [Go back]

For Tuesday, August 13, 2002
© Bob Carver
$-Weighted OEX/QQQ Call/Put Ratios: 0.80/2.78
Popular Indices: http://www.marketclues.net/cgi-bin/myclues?chart=/:/indices/d/_spx.4903.html&member=@@ ^SPX · http://www.marketclues.net/cgi-bin/myclues?chart=/:/indices/d/_compq.4903.html&member=@@ ^IXQ · http://www.marketclues.net/cgi-bin/myclues?chart=/:/indices/d/_ndx.4903.html&member=@@ ^NDX · http://www.marketclues.net/cgi-bin/myclues?chart=/:/indices/d/_dj.4903.html&member=@@ ^DJI · http://www.marketclues.net/cgi-bin/myclues?chart=/:/indices/d/_mid.4903.html&member=@@ ^MID · http://www.marketclues.net/cgi-bin/myclues?chart=/:/indices/d/_oex.4903.html&member=@@ ^OEX · http://www.marketclues.net/cgi-bin/myclues?chart=/:/indices/d/_nya.4903.html&member=@@ ^NYA · http://www.marketclues.net/cgi-bin/myclues?chart=/:/indices/d/_vle.4903.html&member=@@ ^VLE · http://www.marketclues.net/cgi-bin/myclues?chart=/:/indices/d/_rut.4903.html&member=@@ ^RUT · http://www.marketclues.net/cgi-bin/myclues?chart=/:/indices/d/_sml.4903.html&member=@@ ^SML · http://www.marketclues.net/cgi-bin/myclues?chart=/:/futures/d/cr_a0.4903.html&member=@@ ^CRB · http://www.marketclues.net/cgi-bin/myclues?chart=/:/indices/d/_xau.4903.html&member=@@ ^XAU · http://www.marketclues.net/cgi-bin/myclues?chart=/:/indices/d/_btk.4903.html&member=@@ ^BTK · http://www.marketclues.net/cgi-bin/myclues?chart=/:/indices/d/_tyx.4903.html&member=@@ ^TYX
Sector Performance Since: 8 Apr 1999 · 18 Oct 1999 · A Week Ago · A Fortnight Ago
Sector Acceleration Since: 8 Apr 1999 · 18 Oct 1999 · A Week Ago · A Fortnight Ago

MyClues Home Page Link ("http://clues.dhs.org:777/cgi-bin/myclues?myhome=yes&member;[email protected]")

Stocks: Slow Monday

The market opened lower Monday morning, but low volume accompanied a consolidation trading range for most of the rest of the day. By the close, the Dow had made up much of the decline. And, the NASDAQ actually showed good relative strength versus the Dow and S&P 500. That was a reversal of sorts from Friday and indicated that the market was still riding high on hope.

Sentiment reversed too: the OEX trading pit turned gloomy, with more dollars chasing downside bets than upside gambles (80¢ for calls for each dollar of puts). But, on the more public market, the QQQs, option players were bolstered by the relative strength of NDX and poured more than twice as much money ($2.78 for calls for every dollar in puts) into upside bets. We think the strength in NASDAQ will be short-lived: the pattern suggests we are in the final rally of the move right now. That's called a fifth-wave rally, but the entire structure subdivides into three-wave advances and five-wave declines, a sign under Elliott Wave that it is a corrective wave up. The ultimate outcome is expected to be a very strong trend move to the downside to, at the very least, retest the recent low.

Long Term Dow Retracement Levels

In our discussion last weekend, we should have pointed out that the July Dow Industrials low landed very close to a Fibonacci 38% retracement of the entire move up in the 1974-2000 bull market. In Elliott Wave, a 38% retracement is typical of a wave 4 consolidation within a bull market. Thus, there is hope still alive that the entire bear market so far constitutes the first leg down (wave A, the lowest price low of the consolidation) within a very large degree consolidation of that 26-year bull market. Moreover, we still have the potential for new highs (in wave B) to look forward to on the next major rally wave when it comes. Looking even further ahead, the wave 5 that would follow the termination point of this wave 4 could move the market to substantial new highs in the long run, perhaps into the 2008-2011 timeframe. The bottom line is that the probability of this kind of bullish outcome will stay alive as long as the market doesn't substantially break down below about 7480 on the Dow. We expect that retest to occur, but there is no guarantee the Dow will actually hold at that very significant retracement level.

Note that if the 7480 area does not hold, the next Fibonacci support level, the 50% retracement, lies near 6164. Below that, the 62% retracement would carry the Dow just below 5000.

If that 38% retracement support area does hold, however, the bear market rally we would expect is likely to produce upside profits at least twice as fast as the preceding bull market did. That's because bear market rallies move up at a faster rate than bull market rallies.

Long Term Time Cycles

For those interested in long-term stock market cycles, you may be interested in reading
Peter Eliades on Stock Market Cycles ("http://www.gold-eagle.com/gold_digest_02/consensus081202.html").

Format for printing. [Go back]

For Monday, August 12, 2002
© Bob Carver
$-Weighted OEX/QQQ Call/Put Ratios: 2.09/1.71
Popular Indices: http://www.marketclues.net/cgi-bin/myclues?chart=/:/indices/d/_spx.4903.html&member=@@ ^SPX · http://www.marketclues.net/cgi-bin/myclues?chart=/:/indices/d/_compq.4903.html&member=@@ ^IXQ · http://www.marketclues.net/cgi-bin/myclues?chart=/:/indices/d/_ndx.4903.html&member=@@ ^NDX · http://www.marketclues.net/cgi-bin/myclues?chart=/:/indices/d/_dj.4903.html&member=@@ ^DJI · http://www.marketclues.net/cgi-bin/myclues?chart=/:/indices/d/_mid.4903.html&member=@@ ^MID · http://www.marketclues.net/cgi-bin/myclues?chart=/:/indices/d/_oex.4903.html&member=@@ ^OEX · http://www.marketclues.net/cgi-bin/myclues?chart=/:/indices/d/_nya.4903.html&member=@@ ^NYA · http://www.marketclues.net/cgi-bin/myclues?chart=/:/indices/d/_vle.4903.html&member=@@ ^VLE · http://www.marketclues.net/cgi-bin/myclues?chart=/:/indices/d/_rut.4903.html&member=@@ ^RUT · http://www.marketclues.net/cgi-bin/myclues?chart=/:/indices/d/_sml.4903.html&member=@@ ^SML · http://www.marketclues.net/cgi-bin/myclues?chart=/:/futures/d/cr_a0.4903.html&member=@@ ^CRB · http://www.marketclues.net/cgi-bin/myclues?chart=/:/indices/d/_xau.4903.html&member=@@ ^XAU · http://www.marketclues.net/cgi-bin/myclues?chart=/:/indices/d/_btk.4903.html&member=@@ ^BTK · http://www.marketclues.net/cgi-bin/myclues?chart=/:/indices/d/_tyx.4903.html&member=@@ ^TYX
Sector Performance Since: 8 Apr 1999 · 18 Oct 1999 · A Week Ago · A Fortnight Ago
Sector Acceleration Since: 8 Apr 1999 · 18 Oct 1999 · A Week Ago · A Fortnight Ago

MyClues Home Page Link ("http://clues.dhs.org:777/cgi-bin/myclues?myhome=yes&member;[email protected]")

Stocks: Bullish Sentiment Confirms Bear Market Rally Over

Almost everyone is looking for reasons why the July 24th low was the final low in the bear market. At a real bear market bottom, everyone would be looking for a reason why that low wasn't the final low. That almost everyone is still looking for a bottom is a sign of false hope — and hope is the emotion that you don't want to see at the end of a bear market.

After almost three weeks of rally, OEX traders are now overly-bullish, having poured $2.09 into upside bets on Friday for every dollar's worth of downside bets. That puts them officially into the overly-bullish category, a point which has marked turning point tops in the whole bear market for the last couple of years. Although one cannot rely entirely upon just one indicator, this is the most powerful piece in the puzzle. And it's falling into place just as the other indicators are pointing toward a top of some significance and the potential for a renewed decline:

With the market likely to head lower, just where is support? Some observers have pointed to the fact that the S&P 500 Index held support at the 1987-1994 trendline which formed at the significant highs of those years (that trendline is now in the general vicinity of the 770s) and that trendline could be the place where the market will double-bottom. That's a possibility, but the same trendline in the Dow Industrials is currently in the vicinity of 6550 (which also happens to correspond to the same price area as the 1990-1994 support line). Given the extremes we have seen, we can't rule out a further decline of better than 2000 Dow points before this leg of the bear market is complete. And, if the Dow drops that far, the S&P 500 Index would be expected to drop into the 680 range.

While it would be ``nice'' to be able to follow the crowd in turning bullish, it would be neither prudent nor safe. We suggest that the bear has not finished its job of convincing the majority that it doesn't really pay to own stocks — that's what a bear market must do. The technical indicators are overwhelmingly bearish here and are more likely to keep us on the right side of the market despite daily proclamations of hope and faith in the stock market from Bubble-TV (CNBC).

Economy and the Fed

Will the Fed cut interest rates on Tuesday? Maybe, but don't count on it. The Fed doesn't have much fundamental evidence that their rate cuts last year are not working. Unfortunately, they don't have much evidence that they are working either. Technically, though, there is considerable evidence that the economy has already fallen into another decline. First of all, deflation is winning the battle: the Producer Price Index has been in a trend decline for the past three years — and the last year has seen an acceleration in falling prices. The Consumer Price Index, however, has held up with a slight upward trend — the Federal Reserve has a policy objective to keep the CPI rising at about a 2% annual rate because trend growth below that value neutralizes the effectiveness of their policy tools in buoying the economy during a recession.

The copper futures market is confirming that the economy is in a renewed recession. Copper prices are very sensitive to changes in the economy and make a great coincident indicator of economic activity, especially in the housing market. It is somewhat surprising that we are seeing copper prices falling, given the commonly-held notion that lower mortgage rates are spurring home sales. The chart of December Copper illustrates how copper prices peaked at the beginning of June and have plunged 14% since then. Apparently, low interest rates are not counteracting the effects of job losses. If people are worried about their jobs, they are not likely to buy a new house or make large appliance purchases and that's what the copper market is confirming. If the Fed does lower interest rates, it may not make that much difference in the economy — in other words, the Fed just might be ``pushing on a string''.

Another good coincident indicator of the economy is the stock market. And, within the market, the best leading index is the NASDAQ-100. According to our projections in that high-tech index, we should not expect the beginnings of a full recovery for another couple of years.

With the outlook for the economy so poor, investors are going to find the stock market useful only for short term trading, not long term investing. Rallies are made to be sold and dips made to be bought, but buy-and-holders are an extinct breed — at least for a long, long time. Perhaps they'll build a Jurassic Park for long term buy and hold investors someday?

Australian All Ordinaries: http://www.marketclues.net/cgi-bin/myclues?chart=/:/indices/d/_aord.4903.html&member=wcorney@keatepartners.com

The All-Ordinaries followed the US market back up the hill over the last few weeks. They have now encountered resistance at the descending resistance trendline in the daily chart. Potential risk here is for a further 500-point decline before a support trendline comes into play.
Australia Business News http://www.abc.net.au/news/business/default.htm
Yahoo! Australia Business News http://au.dailynews.yahoo.com/Full_Coverage/Australian_Economy/

London Financial-Times 100: http://www.marketclues.net/cgi-bin/myclues?chart=/:/indices/d/_ftse.4903.html&member=wcorney@keatepartners.com

The London market is likely to follow the other markets lower into late August - early September.

Bonds / Interest Rates:

An interesting thing happened to bonds last week: they rallied even with stocks rising. Does this portend a trend change of some significance? Frankly, we don't know, but we think this market is well into a phase driven by intense fear. It's the flip side of the manic stock market, but it's being driven by investors seeking safe haven in the world with very few available. At the same time the government bond market is rallying, corporate bonds are sinking like stones, reflecting the increasing pressure of the debt implosion underway.

If you miss the mania of the bubble stock market, the bond market may suit you just fine. We think it's a similar disaster in the making, however. The only reason to be invested in bonds is for a specific, guaranteed return at a specific time in the future, such as in the Target series of funds or in individual bonds.

Euro Currency: http://www.marketclues.net/cgi-bin/myclues?chart=/:/futures/d/ec_a0.4903.html&member=wcorney@keatepartners.com

Euros consolidated sideways in a contracting triangle formation — a continuation pattern that should see them continue to decline once it's finished this week.

U.S. Dollar Index: http://www.marketclues.net/cgi-bin/myclues?chart=/:/futures/d/dx_a0.4903.html&member=wcorney@keatepartners.com

The Dollar Index is working through that same contracting triangle that the Euro is in — only inverted. Once it's finished this week, the bear market rally in the Dollar Index should resume.

Australian Dollar: http://www.marketclues.net/cgi-bin/myclues?chart=/:/futures/d/ad_a0.4903.html&member=wcorney@keatepartners.com

Australia isn't immune to the worldwide recession (or depression) and the A$ has broken through key support lines. The implication is for new lows into 2003.

Canadian Dollar: http://www.marketclues.net/cgi-bin/myclues?chart=/:/futures/d/cd_a0.4903.html&member=wcorney@keatepartners.com

The collapsing Canadian Dollar entered a countertrend rally after five waves down last week. Resistance is at the halfway retracement price of 64.52¢. Since the move started with five waves, expect a renewed decline after the countertrend rally is over.

Japanese Yen: http://www.marketclues.net/cgi-bin/myclues?chart=/:/futures/d/jy_a0.4903.html&member=wcorney@keatepartners.com

The Japanese Yen also formed five waves down (which implies further decline ahead after a countertrend rally). The 50% retracement should offer stiff resistance at 0.8455.

Swiss Franc: http://www.marketclues.net/cgi-bin/myclues?chart=/:/futures/d/sf_a0.4903.html&member=wcorney@keatepartners.com

Support is at 0.6495, the prior fourth wave termination point.

Target 2030 Zero Coupon Bond Fund Quote

Sectors and Individual Stocks (Subscribers Only)

For tables ranking sectors and individual stocks, and links to charts of 3500 individual stocks and sectors, please visit your very own MyClues Home Page[http://www.marketclues.net/cgi-bin/myclues?myhome=yes&member=@@] -- in the CHARTS & RESEARCH section of the page, you will find a wealth of tools for selecting top sectors and stocks, including access to our exclusive realtime, intraday indicators.

For a 3-4 month free trial subscription, click here.

Commodities (Subscribers Only)

For complete charts of commodities, please visit your very own MyClues Home Page[http://www.marketclues.net/cgi-bin/myclues?myhome=yes&member=@@] -- in the CHARTS & RESEARCH section of the page, you will find links to webpages containing links to the following:

For a 3-4 month free trial subscription, click here.

CRB Index: http://www.marketclues.net/cgi-bin/myclues?chart=/:/futures/d/cr_a0.4903.html&member=wcorney@keatepartners.com

The CRB Index continues to build a very significant topping pattern — a lens formation — as drought buoys grain prices. Overall, though, deflation should rule the commodity markets for some time to come.

Format for printing. [Go back]

For Friday, August 9, 2002
© Bob Carver
$-Weighted OEX/QQQ Call/Put Ratios: 0.96/2.19
Popular Indices: http://www.marketclues.net/cgi-bin/myclues?chart=/:/indices/d/_spx.4903.html&member=@@ ^SPX · http://www.marketclues.net/cgi-bin/myclues?chart=/:/indices/d/_compq.4903.html&member=@@ ^IXQ · http://www.marketclues.net/cgi-bin/myclues?chart=/:/indices/d/_ndx.4903.html&member=@@ ^NDX · http://www.marketclues.net/cgi-bin/myclues?chart=/:/indices/d/_dj.4903.html&member=@@ ^DJI · http://www.marketclues.net/cgi-bin/myclues?chart=/:/indices/d/_mid.4903.html&member=@@ ^MID · http://www.marketclues.net/cgi-bin/myclues?chart=/:/indices/d/_oex.4903.html&member=@@ ^OEX · http://www.marketclues.net/cgi-bin/myclues?chart=/:/indices/d/_nya.4903.html&member=@@ ^NYA · http://www.marketclues.net/cgi-bin/myclues?chart=/:/indices/d/_vle.4903.html&member=@@ ^VLE · http://www.marketclues.net/cgi-bin/myclues?chart=/:/indices/d/_rut.4903.html&member=@@ ^RUT · http://www.marketclues.net/cgi-bin/myclues?chart=/:/indices/d/_sml.4903.html&member=@@ ^SML · http://www.marketclues.net/cgi-bin/myclues?chart=/:/futures/d/cr_a0.4903.html&member=@@ ^CRB · http://www.marketclues.net/cgi-bin/myclues?chart=/:/indices/d/_xau.4903.html&member=@@ ^XAU · http://www.marketclues.net/cgi-bin/myclues?chart=/:/indices/d/_btk.4903.html&member=@@ ^BTK · http://www.marketclues.net/cgi-bin/myclues?chart=/:/indices/d/_tyx.4903.html&member=@@ ^TYX
Sector Performance Since: 8 Apr 1999 · 18 Oct 1999 · A Week Ago · A Fortnight Ago
Sector Acceleration Since: 8 Apr 1999 · 18 Oct 1999 · A Week Ago · A Fortnight Ago

MyClues Home Page Link ("http://clues.dhs.org:777/cgi-bin/myclues?myhome=yes&member;[email protected]")

Stocks: Mini-Mania Grips Market

The stock market's mania continued on Thursday as thin trading conditions gave the bulls an opportunity to generate some short covering on the part of the bears. Since the low on Monday, the Dow Industrials have risen 690 points. You might remember that the Dow fell 745 points from the high last week before bouncing back. Thin trading conditions seem to be the explanation for why the market's volatility is so high right now. Most professional money managers take the entire month of August off, not returning until after Labor Day in early September.

The rally Thursday appears to have just about finished off the rebound and set the market up for the next decline. Early weakness Thursday morning saw virtually no follow-thru on the downside, a sign that the bulls still had control of the market. The mania got out of hand in the last hour (which just happened to coincide with the New Moon, a monthly event typically associated with market turning points) and the market soared on light volume. The pattern we're looking at is a very weak fifth wave diagonal triangle. The outcome of such a pattern is bad news for bulls: a complete, and often more than complete, retracement of the rally.

The rally did expand the resistance arc by a slight amount. Going into Thursday, resistance on the daily Dow cash chart was estimated at 8674 (the resistance line which connects the September 2001 low and significant highs in 2002 in the Daily Dow Industrials Chart). With the intraday print high of 8717, that resistance line was pushed up slightly. Short term considerations suggest the rally could top in the 8750-8763 area (8733-8775 on the September futures) on the Dow, 908 in the September S&P 500 futures. The prior high of 8762 on the cash Dow Industrials lies just above where the market closed Thursday. The corresponding prior high on the S&P 500 cash index lies at 911.64. Above that are two resistance trendlines, at 918.10 and 920.89.

Several Time Ratio turning points are scheduled to occur on Friday morning which are in agreement with the Elliott Wave pattern call. We'll be looking for signs of weakness in the NASDAQ initially, as well as in the broad market. And, speaking of the broad market, measures of market breadth are underperforming the blue chip indices, a sign of great underlying weakness in the market. The relative strength charts (i.e., those prefixed by ``RS_'' in the daily index charts on the website) show a trend lower that belies any price strength the headline indices may be advertising. In fact, that's exactly what the market is trying to do: fool the public into buying back into stocks — just before the roller coaster rounds the top of the hill heading down.

Format for printing. [Go back]

For Thursday, August 8, 2002
© Bob Carver
$-Weighted OEX/QQQ Call/Put Ratios: 0.63/0.76
Popular Indices: http://www.marketclues.net/cgi-bin/myclues?chart=/:/indices/d/_spx.4903.html&member=@@ ^SPX · http://www.marketclues.net/cgi-bin/myclues?chart=/:/indices/d/_compq.4903.html&member=@@ ^IXQ · http://www.marketclues.net/cgi-bin/myclues?chart=/:/indices/d/_ndx.4903.html&member=@@ ^NDX · http://www.marketclues.net/cgi-bin/myclues?chart=/:/indices/d/_dj.4903.html&member=@@ ^DJI · http://www.marketclues.net/cgi-bin/myclues?chart=/:/indices/d/_mid.4903.html&member=@@ ^MID · http://www.marketclues.net/cgi-bin/myclues?chart=/:/indices/d/_oex.4903.html&member=@@ ^OEX · http://www.marketclues.net/cgi-bin/myclues?chart=/:/indices/d/_nya.4903.html&member=@@ ^NYA · http://www.marketclues.net/cgi-bin/myclues?chart=/:/indices/d/_vle.4903.html&member=@@ ^VLE · http://www.marketclues.net/cgi-bin/myclues?chart=/:/indices/d/_rut.4903.html&member=@@ ^RUT · http://www.marketclues.net/cgi-bin/myclues?chart=/:/indices/d/_sml.4903.html&member=@@ ^SML · http://www.marketclues.net/cgi-bin/myclues?chart=/:/futures/d/cr_a0.4903.html&member=@@ ^CRB · http://www.marketclues.net/cgi-bin/myclues?chart=/:/indices/d/_xau.4903.html&member=@@ ^XAU · http://www.marketclues.net/cgi-bin/myclues?chart=/:/indices/d/_btk.4903.html&member=@@ ^BTK · http://www.marketclues.net/cgi-bin/myclues?chart=/:/indices/d/_tyx.4903.html&member=@@ ^TYX
Sector Performance Since: 8 Apr 1999 · 18 Oct 1999 · A Week Ago · A Fortnight Ago
Sector Acceleration Since: 8 Apr 1999 · 18 Oct 1999 · A Week Ago · A Fortnight Ago

MyClues Home Page Link ("http://clues.dhs.org:777/cgi-bin/myclues?myhome=yes&member;[email protected]")

Stocks: A Cat and Mouse Game

The bulls and bears fought to a draw Wednesday. The indices closed up relative to Tuesday's official closing levels, but were barely above Tuesday's intraday highs. In fact, Wednesday's high point was recorded just after the opening, with the rest of the day spent in a slow, water-torture decline, followed by short-covering (profit-taking) to close the indices just below those opening levels.

It's a cat and mouse game. According to some, the hedge funds are the mice who are selling stocks short whenever they find the cats (buyers) away. When the cats show up, the mice snatch up their cheese and run for cover. In the meantime, investors must have patience to wait for this game to end.

The S&P 500 and Dow Industrials could be very close to another leg down. The pattern played out over the last couple of sessions was clearly a corrective (i.e., three-wave) rally. And, the preceding decline was clearly an impulse wave down (i.e., a five-wave move). That tells us the trend is still down and the bears have the advantage despite the rebound. Although it's too early to draw those trendlines we spoke of yesterday, the late rally Wednesday very likely is finished and the next move is logically down. That's because a clear five-wave move was completed by the closing bell — a standard pattern for a c-wave which ends a corrective pattern. The implication is that the major trend down should resume at this point.

Other signs of weakness included poor breadth on the rally: an advance-decline ratio of 1.79 on the NYSE is very poor for a Dow up 174 points. Indeed, the broader market indices underperformed, as did the NASDAQ-100. The latter index retraced more than 62% of the preceding day's rally before moving up near the close on short-covering. That's very weak behavior and suggests further new lows ahead.

The market may be heading for a lower low here on the Dow and S&P 500 indices. The large triangle trading range may not have yet formed its B-wave low. In a contracting triangle within a bear trend, the wave B low point can move into new low ground.

The most positive indicator Wednesday was sentiment for a change. Even the stalwart bulls of the QQQ clan were less than sanguine: they only spent 76¢ on upside bets for every dollar spent betting on the decline. Of course, that's actually logical since the NASDAQ spent most of the day underwater.

Format for printing. [Go back]

For Wednesday, August 7, 2002
© Bob Carver
$-Weighted OEX/QQQ Call/Put Ratios: 1.00/1.19
Popular Indices: http://www.marketclues.net/cgi-bin/myclues?chart=/:/indices/d/_spx.4903.html&member=@@ ^SPX · http://www.marketclues.net/cgi-bin/myclues?chart=/:/indices/d/_compq.4903.html&member=@@ ^IXQ · http://www.marketclues.net/cgi-bin/myclues?chart=/:/indices/d/_ndx.4903.html&member=@@ ^NDX · http://www.marketclues.net/cgi-bin/myclues?chart=/:/indices/d/_dj.4903.html&member=@@ ^DJI · http://www.marketclues.net/cgi-bin/myclues?chart=/:/indices/d/_mid.4903.html&member=@@ ^MID · http://www.marketclues.net/cgi-bin/myclues?chart=/:/indices/d/_oex.4903.html&member=@@ ^OEX · http://www.marketclues.net/cgi-bin/myclues?chart=/:/indices/d/_nya.4903.html&member=@@ ^NYA · http://www.marketclues.net/cgi-bin/myclues?chart=/:/indices/d/_vle.4903.html&member=@@ ^VLE · http://www.marketclues.net/cgi-bin/myclues?chart=/:/indices/d/_rut.4903.html&member=@@ ^RUT · http://www.marketclues.net/cgi-bin/myclues?chart=/:/indices/d/_sml.4903.html&member=@@ ^SML · http://www.marketclues.net/cgi-bin/myclues?chart=/:/futures/d/cr_a0.4903.html&member=@@ ^CRB · http://www.marketclues.net/cgi-bin/myclues?chart=/:/indices/d/_xau.4903.html&member=@@ ^XAU · http://www.marketclues.net/cgi-bin/myclues?chart=/:/indices/d/_btk.4903.html&member=@@ ^BTK · http://www.marketclues.net/cgi-bin/myclues?chart=/:/indices/d/_tyx.4903.html&member=@@ ^TYX
Sector Performance Since: 8 Apr 1999 · 18 Oct 1999 · A Week Ago · A Fortnight Ago
Sector Acceleration Since: 8 Apr 1999 · 18 Oct 1999 · A Week Ago · A Fortnight Ago

MyClues Home Page Link ("http://clues.dhs.org:777/cgi-bin/myclues?myhome=yes&member;[email protected]")

Stocks: Volatile and Schizophrenic Moves Confirm Pattern

In the last month, the Dow Industrials have fallen 1837 points (from 9410 to 7537), risen 1225 points (from 7537 to 8762), and fallen 732 points (from 8762 to 8030). On Tuesday, the Dow rose 388 points to a high of 8418 before falling to close at 8274. If the market were an automobile, we'd have to conclude that its driver is drunk, crazy or both. Since it's just the stock market, we take it as a sign that, as a whole, the market really doesn't know which way to go. That schizophrenia, coupled with high, but falling, volatility (price swings both up and down) tells us a lot about the character of the market. In fact, it's symptomatic of an Elliott Wave contracting triangle as we illustrated in this last weekend's diagram (see the update for Monday, August 5th).

Knowing the pattern helps, but trading this market is really difficult whether you're a bull or a bear (or just try to play both sides of the market). We expected the market to rally, but to have it start the rally in the middle of the American nighttime makes it pretty difficult to play. That's exactly what happened and some commentators are convinced the bullish turn of events was spearheaded by Treasury Secretary Paul O'Neill and his Plunge Protection Team (PPT). After all, what better place to start a rally than in the thin overnight futures market? Especially since the market had formed five waves down on Monday and came into Tuesday deeply oversold?

Well, whomever was responsible, they definitely sent the market soaring early on. Resistance in the area around 8400 on the Dow stalled the move. Near the close those gains were trimmed. We're interpreting the rally as an a-b-c affair with the a-wave (up) completed on Tuesday, the same day it began, the b-wave (down) almost completed by the close, with the c-wave (up) yet to go. Wave c should resume the rally into overhead resistance on the daily chart around 8600 basis the September Dow Industrials (note the position of the violet polytrend resistance line).

At this point, it's difficult to know the exact count on this large, sideways contracting triangle — essentially, a large trading range with lower highs and higher lows and decreasing volatility, to be followed by a plunge to a lower low after it traces out five waves (ABCDE) — but we can suggest that waves A and B may have already finished. This rally would then be counted as the middle wave C in the sequence. If that's the case, the top of this rally will help define a downsloping resistance line (AC). Once that top is in, the next leg down, wave D will define an upsloping support line (BD). The intersection of those two trendlines, the apex of the contracting triangle, will give us a good estimate for the time at which the final thrust to the downside will end.

Remember, this is an early pattern call and subsequent market action can (and probably will) force us to refine it. For one thing, if wave A is larger in degree than we think it is, the market could still be working through it. We think that's not likely, but that possibility can't be entirely eliminated yet. Hopefully, we are in wave C. That means these crazy days of hither-and-thither market moves will soon be finished. Then, we can depend upon a trend lasting longer than a few hours.

Speaking of trend: We've been reluctant to hold any trading positions overnight due to the extremely high volatility in the market. The early Tuesday morning action should help validate our cautious approach to holding overnight, we think.

Format for printing. [Go back]

For Tuesday, August 6, 2002
© Bob Carver
$-Weighted OEX/QQQ Call/Put Ratios: 0.27/2.85
Popular Indices: http://www.marketclues.net/cgi-bin/myclues?chart=/:/indices/d/_spx.4903.html&member=@@ ^SPX · http://www.marketclues.net/cgi-bin/myclues?chart=/:/indices/d/_compq.4903.html&member=@@ ^IXQ · http://www.marketclues.net/cgi-bin/myclues?chart=/:/indices/d/_ndx.4903.html&member=@@ ^NDX · http://www.marketclues.net/cgi-bin/myclues?chart=/:/indices/d/_dj.4903.html&member=@@ ^DJI · http://www.marketclues.net/cgi-bin/myclues?chart=/:/indices/d/_mid.4903.html&member=@@ ^MID · http://www.marketclues.net/cgi-bin/myclues?chart=/:/indices/d/_oex.4903.html&member=@@ ^OEX · http://www.marketclues.net/cgi-bin/myclues?chart=/:/indices/d/_nya.4903.html&member=@@ ^NYA · http://www.marketclues.net/cgi-bin/myclues?chart=/:/indices/d/_vle.4903.html&member=@@ ^VLE · http://www.marketclues.net/cgi-bin/myclues?chart=/:/indices/d/_rut.4903.html&member=@@ ^RUT · http://www.marketclues.net/cgi-bin/myclues?chart=/:/indices/d/_sml.4903.html&member=@@ ^SML · http://www.marketclues.net/cgi-bin/myclues?chart=/:/futures/d/cr_a0.4903.html&member=@@ ^CRB · http://www.marketclues.net/cgi-bin/myclues?chart=/:/indices/d/_xau.4903.html&member=@@ ^XAU · http://www.marketclues.net/cgi-bin/myclues?chart=/:/indices/d/_btk.4903.html&member=@@ ^BTK · http://www.marketclues.net/cgi-bin/myclues?chart=/:/indices/d/_tyx.4903.html&member=@@ ^TYX
Sector Performance Since: 8 Apr 1999 · 18 Oct 1999 · A Week Ago · A Fortnight Ago
Sector Acceleration Since: 8 Apr 1999 · 18 Oct 1999 · A Week Ago · A Fortnight Ago

MyClues Home Page Link ("http://clues.dhs.org:777/cgi-bin/myclues?myhome=yes&member;[email protected]")

Stocks: Slide Downhill Continues

The market was exceptionally weak Monday as the NASDAQ slid well below the July low (to a new 2002 low) and the Dow fell below the halfway retracement price. While OEX option sentiment is constructive with only 27¢ being bet on the upside for each dollar of downside bets, the QQQ players remain incredibly bullish in the face of lower lows. They spent $2.85 betting on the upside Monday for each dollar bet on the downside — and this is after several days of overly-bullish readings on this sentiment gauge that's tied to the QQQ shares, which itself is tied to the NASDAQ-100 Index. We may have to get the ``cube-sentiment'' to switchover to the bearish camp before the market can turn up.

The only real positives for stocks on Tuesday will be a severely oversold condition, near term support levels (the 62% retracement support price of 8008 on the Dow is near), the tendency for the market to find legs on Tuesday afternoon (the Tuesday Turnaround phenomenon we've mentioned in times past), and an overbought bond market. There are also some potential areas of support around 7950, including a short term uptrend line, that could provide a place for the market to circle the wagons.

If the market can find a bottom and rally back, we'd look for new relative highs above last week's in the short term.

Format for printing. [Go back]

For Monday, August 5, 2002
© Bob Carver
$-Weighted OEX/QQQ Call/Put Ratios: 0.50/1.22
Popular Indices: http://www.marketclues.net/cgi-bin/myclues?chart=/:/indices/d/_spx.4903.html&member=@@ ^SPX · http://www.marketclues.net/cgi-bin/myclues?chart=/:/indices/d/_compq.4903.html&member=@@ ^IXQ · http://www.marketclues.net/cgi-bin/myclues?chart=/:/indices/d/_ndx.4903.html&member=@@ ^NDX · http://www.marketclues.net/cgi-bin/myclues?chart=/:/indices/d/_dj.4903.html&member=@@ ^DJI · http://www.marketclues.net/cgi-bin/myclues?chart=/:/indices/d/_mid.4903.html&member=@@ ^MID · http://www.marketclues.net/cgi-bin/myclues?chart=/:/indices/d/_oex.4903.html&member=@@ ^OEX · http://www.marketclues.net/cgi-bin/myclues?chart=/:/indices/d/_nya.4903.html&member=@@ ^NYA · http://www.marketclues.net/cgi-bin/myclues?chart=/:/indices/d/_vle.4903.html&member=@@ ^VLE · http://www.marketclues.net/cgi-bin/myclues?chart=/:/indices/d/_rut.4903.html&member=@@ ^RUT · http://www.marketclues.net/cgi-bin/myclues?chart=/:/indices/d/_sml.4903.html&member=@@ ^SML · http://www.marketclues.net/cgi-bin/myclues?chart=/:/futures/d/cr_a0.4903.html&member=@@ ^CRB · http://www.marketclues.net/cgi-bin/myclues?chart=/:/indices/d/_xau.4903.html&member=@@ ^XAU · http://www.marketclues.net/cgi-bin/myclues?chart=/:/indices/d/_btk.4903.html&member=@@ ^BTK · http://www.marketclues.net/cgi-bin/myclues?chart=/:/indices/d/_tyx.4903.html&member=@@ ^TYX
Sector Performance Since: 8 Apr 1999 · 18 Oct 1999 · A Week Ago · A Fortnight Ago
Sector Acceleration Since: 8 Apr 1999 · 18 Oct 1999 · A Week Ago · A Fortnight Ago

MyClues Home Page Link ("http://clues.dhs.org:777/cgi-bin/myclues?myhome=yes&member;[email protected]")

Stocks: No Wall of Worry = No Bull Market

We've seen a great bear market rally over the past couple of weeks that fizzled out on Thursday (on Tuesday for the NASDAQ). For investors, this has been an exhilarating, but ultimately frustrating market. From the feeling that the market had discounted a non-existent ``double-dip'' recession to the realization that the recession had restarted down that slippery slope again (most economists are still in denial on this point), the market soared and then sank. The recent leg down in stocks was not some wild bear fantasy that somehow came true, it was an accurate reflection of the state of the economy. Thus, stocks were overvalued at May highs — even the darling Small Caps which had made new highs at that time. Whether stocks are currently overvalued is hard to say for sure (they probably are since earnings restatements due to option and pension expenses should lower reported earnings by about 10%), but the technical indicators (which are never restated like the ``funnymentals'' that accountants deal with) say we have much more work to do in this bear market. That work can take two paths: sideways and down. We think the majority of the work of the bear market in terms of price decline is already behind us (although there is still a potentially large drop in price ahead, it could be extended over time so that the rate of decline is much less than we have seen to date). That leaves mostly the sideways path to wring stock from investors' grasp. As you know, sideways markets use the passage of time to turn the crowd bearish.

How to survive the bear market? CNBC asked the question (omitting the ``bear'' part for fear of jinxing the rally), but didn't really answer it last week. We have an answer: either take the conservative route (as Bob Prechter details in Conquer the Crash) or take the aggressive route and wrench profits from this bear market — as we have been doing: trading this market and keeping risk low by use of close stop loss orders.

Sentiment is the best guide as to whether or not the market made a good bottom in the last two weeks. When everyone is looking for the bottom, you just can't get one. When everyone has given up in disgust with the stock market, that's the time to say we've probably seen the lows. Overly-bullishness was never more evident than in the NASDAQ-100 options (QQQ options), where the crowd was buying the dips like they'd never get another chance to throw their money away. By Friday, though, they'd lost enough money to be dissuaded from throwing as much good money after bad: they only spent $1.22 on bets the NASDAQ-100 would rise for every $1 that it would fall. For the week as a whole, they spent $467,081,000 on bullish bets to only $211,687,100 for the bearish case. The NASDAQ-100 (NDX) topped out midday Tuesday (the Dow and S&P 500 topped on Thursday morning), but the decline from Tuesday, which retraced virtually all of the gains over the last two weeks, only seemed to encourage this pseudo-gambler mentality.

OEX sentiment was much more circumspect. The more professional options arena saw only $133,742,900 bet on a continuing rally and $132,958,800 bet on a decline. In general, though, both options pits showed far too much bullishness for this pop fly rally to be anything grander than a short-covering bear market affair. We need to get much more money being bet on the downside (i.e., put options) for there to be any chance that a bottom is in place. In fact, we need to see the market rallying sharply while the crowd is intent on buying puts to protect themselves from the ``next'' big selloff. To paraphrase Barron's, ``Bear markets decline on a slope of hope, just as bull markets rise on a wall of worry.''

Overall, this market is tracing out a trading range pattern in the blue chip Dow Industrials and S&P 500. The projection for a bottom in the bear market in the NASDAQ-100 points to August 2004 and the market could work its way considerably lower in price by the time we get there. We think the low could come somewhere in the 500-800 range. But, since the bottom is perhaps 2 years out, there should be plenty of trading opportunities in the meantime. Due to the volatility of the NASDAQ, however, we suggest trading be concentrated in the Dow Industrials and S&P 500 indices. A move down into that price range below 800 essentially will wipe out all of the gains in the NASDAQ-100 since 1995, the last time it traded there.

The trading range environment is similar to the market of the 'Seventies which corrected the excesses of the 'Fifties and 'Sixties. Although the market did essentially trade between Dow 577 and 1051 for about sixteen years, inflation during that period of time wiped out about as much equity value as had the Great Depression. This bear market is likely to perform a similar feat, but without the inflation component. Whether we get the massive deflation impact like the 'Thirties is still an open question, but we must observe that Bob Prechter's observations in Conquer the Crash are beginning to ring true as the mountain of debt overhanging the world's economy comes crashing down. Prechter may still be too bearish, but we think his long term analyses of the dire straits of the current economic situation are far more accurate than the great mass of economists who only seem to see the world through rose-colored glasses. Prechter was early in calling a top in the mania, but nonetheless his forecast of a devastating bear market to follow the bubble top has proven accurate in the years since. According to Prechter, we're still only in the early stages of this secular bear market.

Short term, the selloff in the Dow did much less price damage than the one in NASDAQ. If they can circle the wagons at the halfway retracement price in the Dow (we had a 38% retracement as of the close Friday — and the low was close to an exact 50% retracement at 8152), we could get a chance to buy for a trade on Monday (if you're a trader, see our Trading Page for intraday updates, indicators and analysis, as well as trades we enter and exit in the Dow in real time — this page is oriented toward short term futures traders with an account size of approximately $15,000). NASDAQ entered a consolidation in the last hours of trading Friday which we are counting as a wave 4 within a five-wave downleg. For the Dow, this is probably a b-wave correction of the late July rally with a c-wave rally to follow to a higher high. For longer term investors, however, we're not sending email alerts on these trades because of their short term duration. If we do decide to enter any new investment positions, you will receive an email if you signed up to be notified (the signup and unsubscribe links are on your MyClues in the Special Reports section header). We don't expect to be entering any new investment positions in the near future, but reserve the right to change our position if market conditions take a turn for the better.

This bear market rally on the back of the rising 22-week trading cycle, with the c-wave to follow and end it, is likely to constitute wave A within a large contracting triangle formation as the following chart illustrates. Once the 22-week cycle tops out — and in the teeth of this bear market, that cycle could top as early as next week — we should see the market decline in a wave B to a possibly lower low.

http://www.marketclues.net/img/_dj.gif

The next big bubble to burst may be the real estate market. Declines in interest rates over the past few years have fueled that bubble. It remains to be seen whether the Fed will aggressively ease here to keep that bubble from bursting, but new home sales are plummeting along with rents. It appears that the real estate market is following the stock market down. An emergency interest rate cut of ¾% is the medicine the market needs, but the Fed is still sitting on its hands watching the economy slide into the ditch — not unlike what it did in 2000 just before panicking and slashing rates in 2001.

At the rate things are going, the Republican Party is going to suffer a crushing defeat in the midterm election this November. That could setup a situation where a lame duck President (Bush) spends most of his time wrangling with Congress rather than fighting the recession. However, the Democratic politicians (not the average Democrat, mind you) who secretly hope for the recession to last into the next Presidential Election cycle in 2004, may get just as much blame for the economy and the stock market staying in this ditch. If things get as bad as they appear to be destined to be, both parties may have to worry about a huge voter backlash throwing all the rascals out.

It may be time to cue the US military to launch that invasion of Iraq. Given the experience of Bush Sr in 1991, that just won't be enough to give Bush Jr a second term, but it may be seen as the ``right thing to do'' for both defense considerations as well as political ones. And, despite the denials, it is more likely to happen in October — right before the elections — than afterward. We're sure there are good excuses to be offered, such as getting the job done before Iraq is able to produce working nuclear bombs, before the onset of winter, surprising Iraq by denying we'd do it in October, then really doing it, etc, etc. If this war can be gotten mostly out of the way by November or December (similar to the previous short duration War on Iraq in 1991), it could provide the impetus for a much larger bear market rally in the stock market starting late this year.

Euro Currency: http://www.marketclues.net/cgi-bin/myclues?chart=/:/futures/d/ec_a0.4903.html&member=wcorney@keatepartners.com

The path to 90¢ is clear as the correction continues.

U.S. Dollar Index: http://www.marketclues.net/cgi-bin/myclues?chart=/:/futures/d/dx_a0.4903.html&member=wcorney@keatepartners.com

The bear market rally in the Dollar Index should retrace 38-62% of the initial wave down. Those targets are shown in the daily chart.

Australian Dollar: http://www.marketclues.net/cgi-bin/myclues?chart=/:/futures/d/ad_a0.4903.html&member=wcorney@keatepartners.com

The Aussie Dollar has been consolidating in the area of the previous fourth wave, which also coincides with two significant support lines as shown in the chart. We expect a rise into the September-October Time Ratio Highs, corresponding to a rise of about a nickel from current levels.

Japanese Yen: http://www.marketclues.net/cgi-bin/myclues?chart=/:/futures/d/jy_a0.4903.html&member=wcorney@keatepartners.com

The total collapse of the Japanese Yen has resumed. The Japanese economy's lifeline is its export trade, which is due to collapse in this recession, taking the currency to a status of complete worthlessness — a process that will work itself out over the next few years.

Australian All Ordinaries: http://www.marketclues.net/cgi-bin/myclues?chart=/:/indices/d/_aord.4903.html&member=wcorney@keatepartners.com

The Australian market is not immune to the global slowdown. The long term secular bull market is over. Trading becomes the way to make money in this market, as well as all others. The wave 4 rally in the US markets should help Aussie stocks rise in the near term, but watch for a dip into September-October coinciding with the last leg down in the US bear market.

Bonds / Interest Rates:

Target 2030 Zero Coupon Bond Fund Quote

Are bonds a good alternative to stocks? With the government's deficit exploding along with credit spreads, the flight to safety play has been into US government bonds — so far. We doubt this can last, but the market hasn't been worried about the ability of the government to repay its debts — yet.

Sectors and Individual Stocks (Subscribers Only)

For tables ranking sectors and individual stocks, and links to charts of 3500 individual stocks and sectors, please visit your very own MyClues Home Page[http://www.marketclues.net/cgi-bin/myclues?myhome=yes&member=@@] -- in the CHARTS & RESEARCH section of the page, you will find a wealth of tools for selecting top sectors and stocks, including access to our exclusive realtime, intraday indicators.

For a 3-4 month free trial subscription, click here.

Commodities (Subscribers Only)

For complete charts of commodities, please visit your very own MyClues Home Page[http://www.marketclues.net/cgi-bin/myclues?myhome=yes&member=@@] -- in the CHARTS & RESEARCH section of the page, you will find links to webpages containing links to the following:

For a 3-4 month free trial subscription, click here.

CRB Index: http://www.marketclues.net/cgi-bin/myclues?chart=/:/futures/d/cr_a0.4903.html&member=wcorney@keatepartners.com

A decline below the yellow support line the daily chart would confirm the next major leg down in commodity price deflation.

Format for printing. [Go back]

For Friday, August 2, 2002
© Bob Carver
$-Weighted OEX/QQQ Call/Put Ratios: 0.83/6.71
Popular Indices: http://www.marketclues.net/cgi-bin/myclues?chart=/:/indices/d/_spx.4903.html&member=@@ ^SPX · http://www.marketclues.net/cgi-bin/myclues?chart=/:/indices/d/_compq.4903.html&member=@@ ^IXQ · http://www.marketclues.net/cgi-bin/myclues?chart=/:/indices/d/_ndx.4903.html&member=@@ ^NDX · http://www.marketclues.net/cgi-bin/myclues?chart=/:/indices/d/_dj.4903.html&member=@@ ^DJI · http://www.marketclues.net/cgi-bin/myclues?chart=/:/indices/d/_mid.4903.html&member=@@ ^MID · http://www.marketclues.net/cgi-bin/myclues?chart=/:/indices/d/_oex.4903.html&member=@@ ^OEX · http://www.marketclues.net/cgi-bin/myclues?chart=/:/indices/d/_nya.4903.html&member=@@ ^NYA · http://www.marketclues.net/cgi-bin/myclues?chart=/:/indices/d/_vle.4903.html&member=@@ ^VLE · http://www.marketclues.net/cgi-bin/myclues?chart=/:/indices/d/_rut.4903.html&member=@@ ^RUT · http://www.marketclues.net/cgi-bin/myclues?chart=/:/indices/d/_sml.4903.html&member=@@ ^SML · http://www.marketclues.net/cgi-bin/myclues?chart=/:/futures/d/cr_a0.4903.html&member=@@ ^CRB · http://www.marketclues.net/cgi-bin/myclues?chart=/:/indices/d/_xau.4903.html&member=@@ ^XAU · http://www.marketclues.net/cgi-bin/myclues?chart=/:/indices/d/_btk.4903.html&member=@@ ^BTK · http://www.marketclues.net/cgi-bin/myclues?chart=/:/indices/d/_tyx.4903.html&member=@@ ^TYX
Sector Performance Since: 8 Apr 1999 · 18 Oct 1999 · A Week Ago · A Fortnight Ago
Sector Acceleration Since: 8 Apr 1999 · 18 Oct 1999 · A Week Ago · A Fortnight Ago

MyClues Home Page Link ("http://clues.dhs.org:777/cgi-bin/myclues?myhome=yes&member;[email protected]")

Stocks: More Bad News

The stock market reconnected with the economy on Thursday as several reports confirmed our opinion that we are now in the second recession in two straight years. Perhaps people will start taking Prechter, author of
Conquer the Crash, more seriously now that it's not only the stock market crash telling us things are not getting any better. The purchasing manager's report (ISM) showed that growth in the economy virtually disappeared last month. An unexpected rise in unemployment claims also hit the stock market like a load of bricks. The initial selloff turned Wednesday's ``pop-fly'' rally into a rout to the downside. The market spent most of the day attempting to rebound, but managed only a halfway retracement before plunging again near the close.

The market has the Monthly Employment Report, due out at 8:30 a.m. EDT Friday morning, to look forward to. While government figures often have little relationship to the real world, this report is highly watched as an indicator of the direction of stock prices and interest rates. It's the market's reaction to the numbers which should be watched, however. A market which takes bad news in stride is a market with a bullish bias. Conversely, a market which fails to rally on good news is a market with a bearish bias. It doesn't matter what the actual news is, which is good because the government numbers are usually heavily revised (and probably never end up being truly accurate).

The pattern traced out in Thursday's session was a clearly corrective A-B-C with the C-wave covering a Fibonacci 62% of the length of wave A. That sets the market up to rally Friday morning — if it's so inclined based upon the report. If, however, the major bear market downtrend has resumed, even good news probably won't be enough to hold this market above the abyss.

The gaps formed in Monday's session have yet to be filled. If we do get a selloff Friday, those gaps are going to be the first place the market will head to.

We're still at the time of month we call the Monthly Buying Spree, a time of month when mutual fund managers tend to buy stocks with new investment cash infusion from 401-k participants. This month's Spree seems to have already ended, however, but the green bullish divergences in the Money Flow charts probably are due to that money being put to work in the down market.

Speaking of buying in a down market, those wacky QQQ option traders were buying call options again on Thursday. They ended up pouring $6.71 into a gamble that the market would rally for every $1 they bet that the market would resume its major trend down. They were buying the dip for all it was worth, something they haven't done with this conviction since March 2000. Need we remind you that the QQQ shares were selling for over $100 apiece then? Or, that they closed Thursday at $22.73, down 4.7% for the day (and down over 81% in the last 2½% years)? These traders make the OEX crowd look smart in comparison!

Looking for the Trading Page?

In case you haven't found it, look in the section labeled ``Intraday Indicators & Charts on your MyClues page. The first link in that section is Trading Page. When you click on that link, the Trading Page will open in a new window. We've made some improvements to the page and will be updating the Help Page in the near future. If we have issued a trading signal, the bottom part of the page will highlight in yellow for two minutes to alert you of the order. The last order issued appears in that bottom portion, so if there are a sequence of orders, note that only the last order will be shown there. To see all of the orders, look in the Trading Orders part of the page. But, remember that the order will appear in that bottom part of the page first. After that we will update the Trading Orders part of the page.

Here's a real life example of a sequence of day-only orders we executed on Thursday afternoon (all orders are day orders unless otherwise specified):

  1. We sold a September Dow Jones Industrials contract (ticker symbol DJ2U) short at the market. The market price we executed the sell order at was 8540. At $10 per point in the Dow Jones contract, that represents a contract value of $85,400. The signal was given as "Sell 1 DJ2U at MARKET". This meant that we established a short position at the best available price at the time the order entered the market, with the expectation that we would be able to buy the contract back later at a lower price for a profit. This turned out to be true.
  2. After our order was filled, we placed a protective stop loss order to "Buy 1 DJ2U at 8650 STOP". This stop loss order limited our loss to approximately $1100 (110 points = $1100) if the market turned and rallied against us.
  3. After the market declined more and we had some paper profits built up in the position, we replaced our stop loss order with one to "Buy 1 DJ2U at 8560 STOP". This meant that we would exit the position if we showed a $200 paper loss or greater (20 points). This greatly limited our exposure to the market's fluctuations. Neither of our stop orders were elected as the market continued to decline.
  4. Finally, we decided to take profits at the close because the C-wave landed on a short term support line, which also happened to be the place where its length equalled 62% of the travel of the preceding wave down, wave A. We entered an order to "Buy 1 DJ2U MARKET ON CLOSE (MOC)". This order was executed on the close at 16:15 EDT and we ended the session flat (no position outstanding).

We ended the day with a $550 trading profit.

Format for printing.

August 2002 Web Comments

July 2002 Web Comments

June 2002 Web Comments

May 2002 Web Comments

April 2002 Web Comments

March 2002 Web Comments

February 2002 Web Comments

January 2002 Web Comments

December 2001 Web Comments

November 2001 Web Comments

October 2001 Web Comments

September 2001 Web Comments

August 2001 Web Comments

July 2001 Web Comments

June 2001 Web Comments